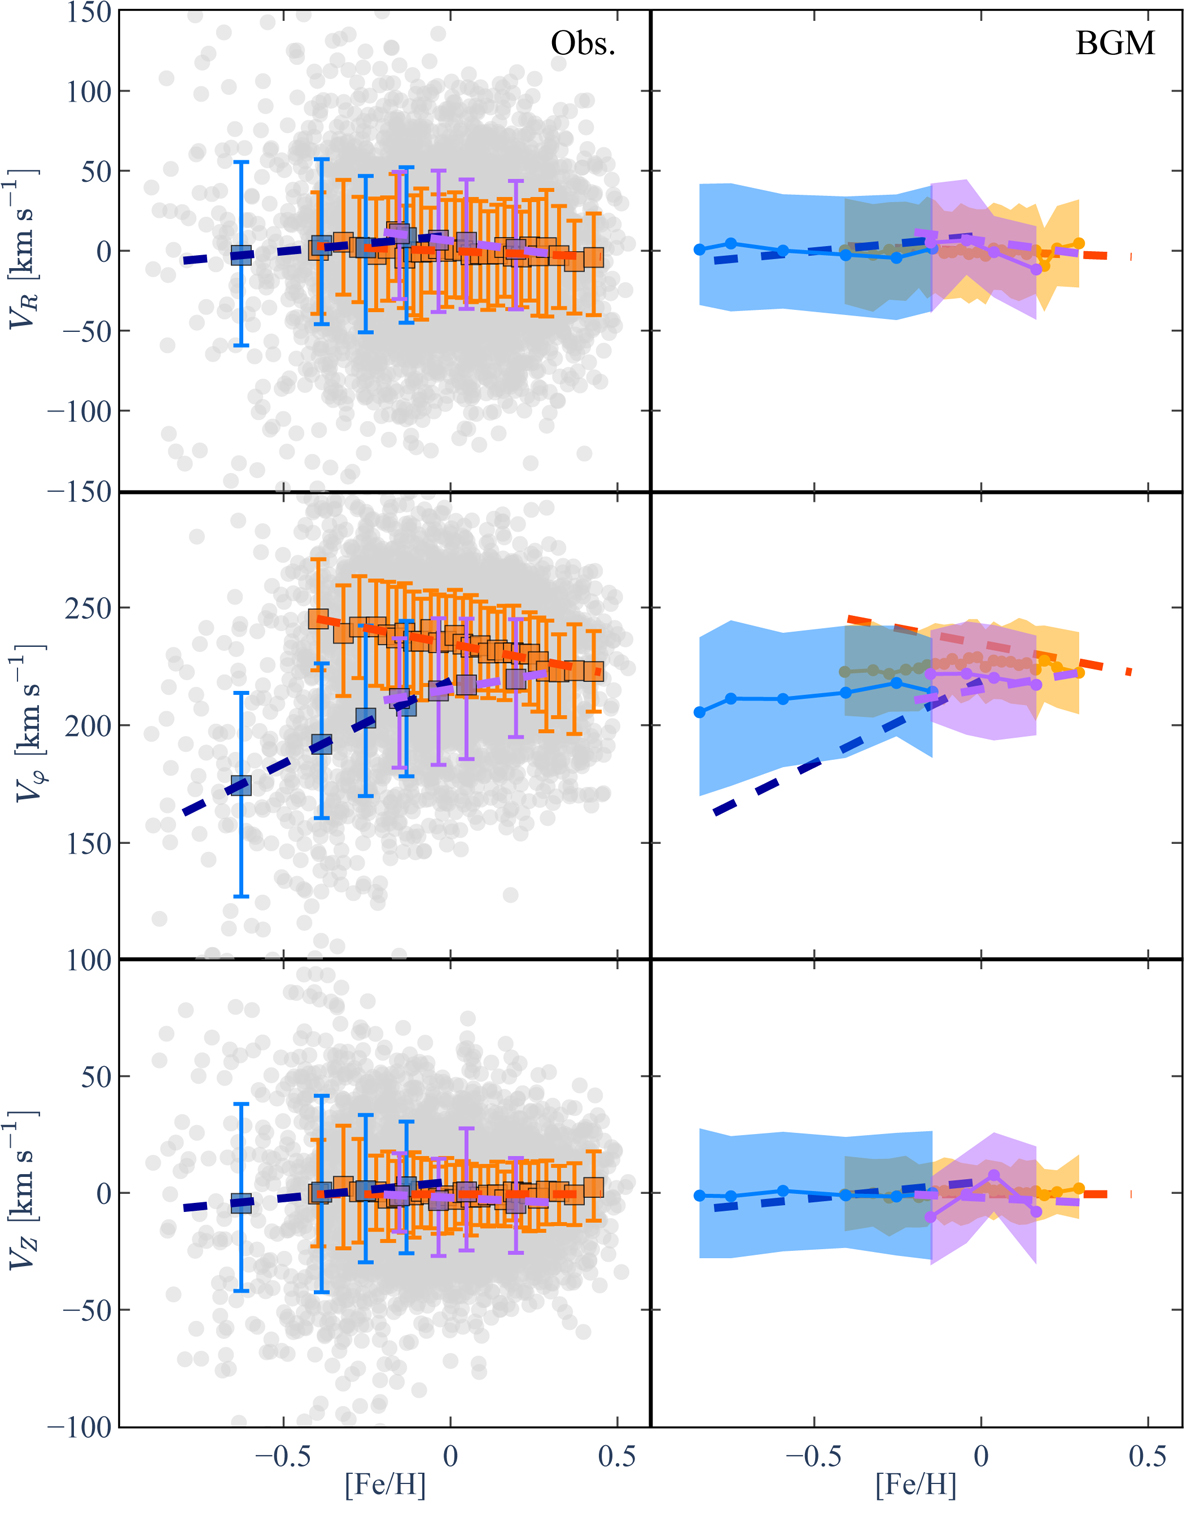
Fig. 11.
Download original image
Velocities in the Galactocentric cylindrical coordinate frame as a function of [Fe/H]. Left panels: all sample stars are shown (grey dots). The mean value per [Fe/H] bin is shown for the thin- (orange), hαmr- (purple), and hαmp thick-disc (blue) populations. The mean value has been computed between the 5% and 95% quantiles of the sample to avoid extreme values. The ±1σ error bars are shown. The dashed lines are the linear fits. Right panels: BGM predictions (orange, purple and blue solid lines) for the APOKASC sample as a function of [Fe/H] compared to the linear fits done using observations (dashed lines). The ±1σ error bars are shown with the shadow zones.
Current usage metrics show cumulative count of Article Views (full-text article views including HTML views, PDF and ePub downloads, according to the available data) and Abstracts Views on Vision4Press platform.
Data correspond to usage on the plateform after 2015. The current usage metrics is available 48-96 hours after online publication and is updated daily on week days.
Initial download of the metrics may take a while.