Open Access
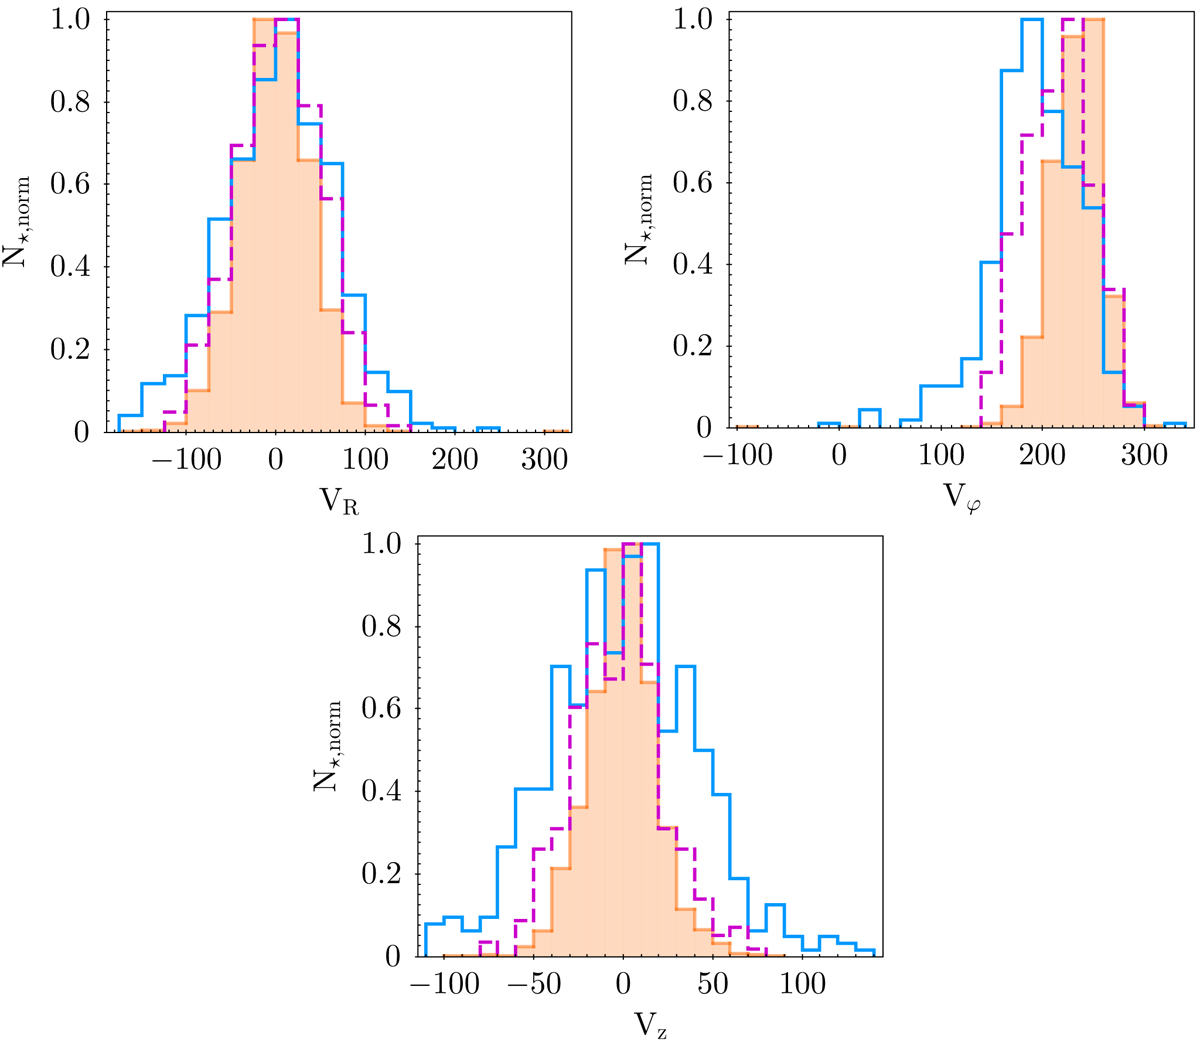
Fig. 10.
Download original image
Normalised distribution of the velocities VR, Vφ, and VZ (in km s−1) for the thin-disc (orange solid line), hαmp thick-disc (blue solid line), and the hαmr thick-disc populations (magenta dashed line), with a clear tail showing the asymmetric drift in the Vφ panel. These distributions are shown for the APOKASC sample.
Current usage metrics show cumulative count of Article Views (full-text article views including HTML views, PDF and ePub downloads, according to the available data) and Abstracts Views on Vision4Press platform.
Data correspond to usage on the plateform after 2015. The current usage metrics is available 48-96 hours after online publication and is updated daily on week days.
Initial download of the metrics may take a while.