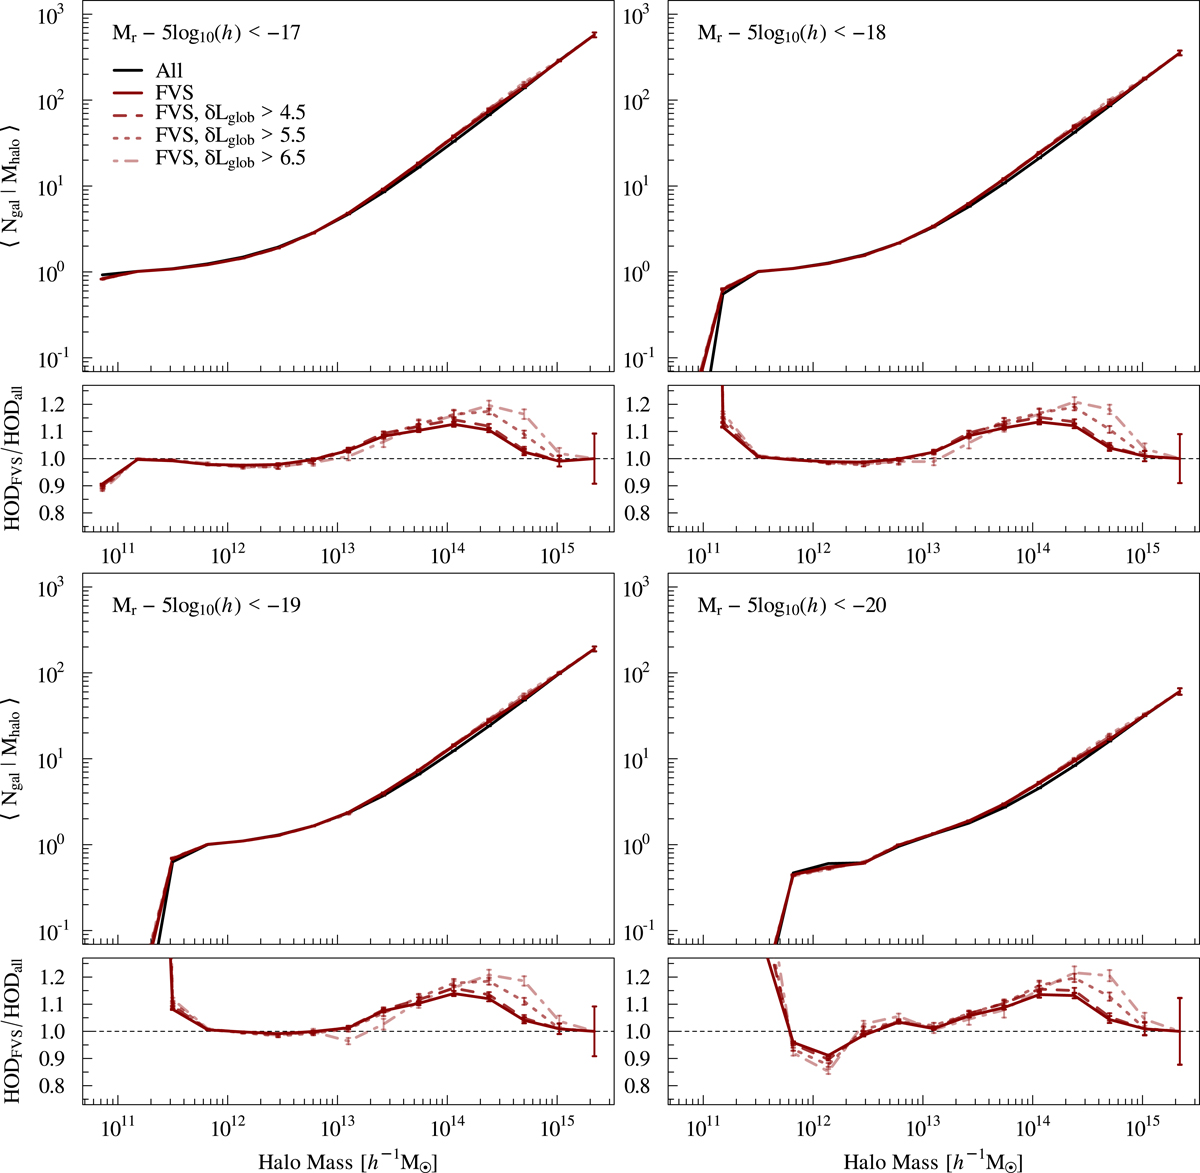
Fig. 6.
Download original image
HOD measured for different luminosity thresholds. The different panels show the results for magnitude limits Mr − 5log(h) ranging from −17 to −20. The solid black lines represent the overall HOD, and the solid red line shows the HOD measured inside the complete FVS catalogue. The dashed red lines are the HOD in the FVS as a function of the global luminosity overdensity, δLglob. For each magnitude bin, the ratio of the FVS HODs and the overall HOD (solid black line in the main panels) is shown at the bottom of each panel. The uncertainties are calculated by the standard jackknife procedure.
Current usage metrics show cumulative count of Article Views (full-text article views including HTML views, PDF and ePub downloads, according to the available data) and Abstracts Views on Vision4Press platform.
Data correspond to usage on the plateform after 2015. The current usage metrics is available 48-96 hours after online publication and is updated daily on week days.
Initial download of the metrics may take a while.