Fig. 11.
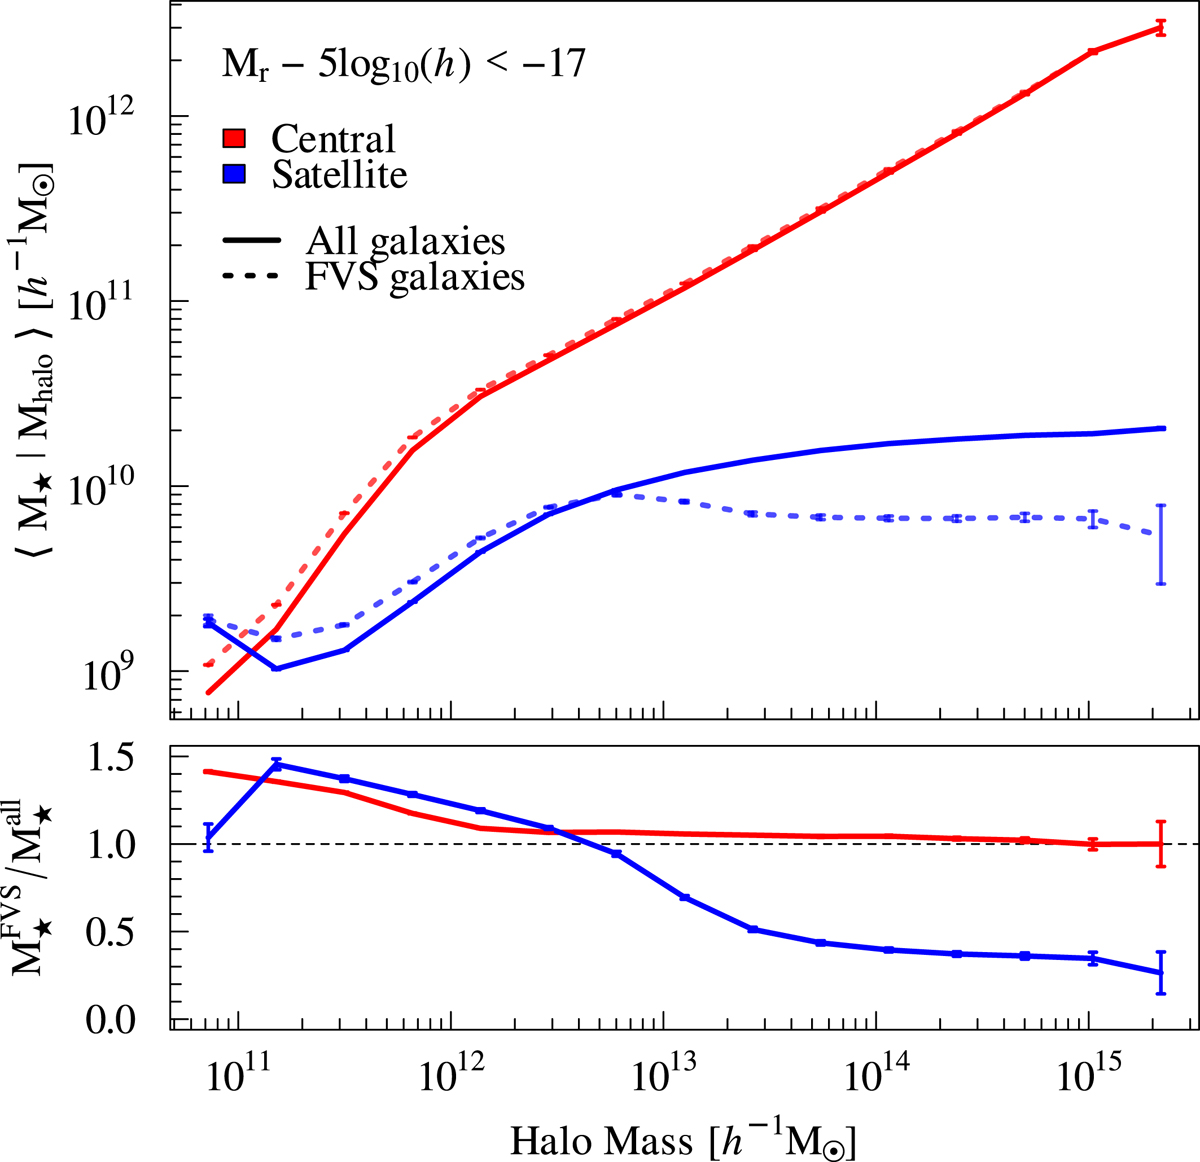
Download original image
Stellar mass content in central (red lines) and satellite galaxies (blue lines). Upper panel: ⟨M⋆|Mhalo⟩ as a function of the halo mass for galaxies inside the FVS (dotted lines) and all galaxies (solid lines). Bottom panel: ratio of M⋆ for galaxies in the FVS and the overall population. Error bars are computed using the standard jackknife procedure. For the central and satellite galaxies, Mhalo corresponds to the M200c of the main halo of the group.
Current usage metrics show cumulative count of Article Views (full-text article views including HTML views, PDF and ePub downloads, according to the available data) and Abstracts Views on Vision4Press platform.
Data correspond to usage on the plateform after 2015. The current usage metrics is available 48-96 hours after online publication and is updated daily on week days.
Initial download of the metrics may take a while.