Fig. D.1
Download original image
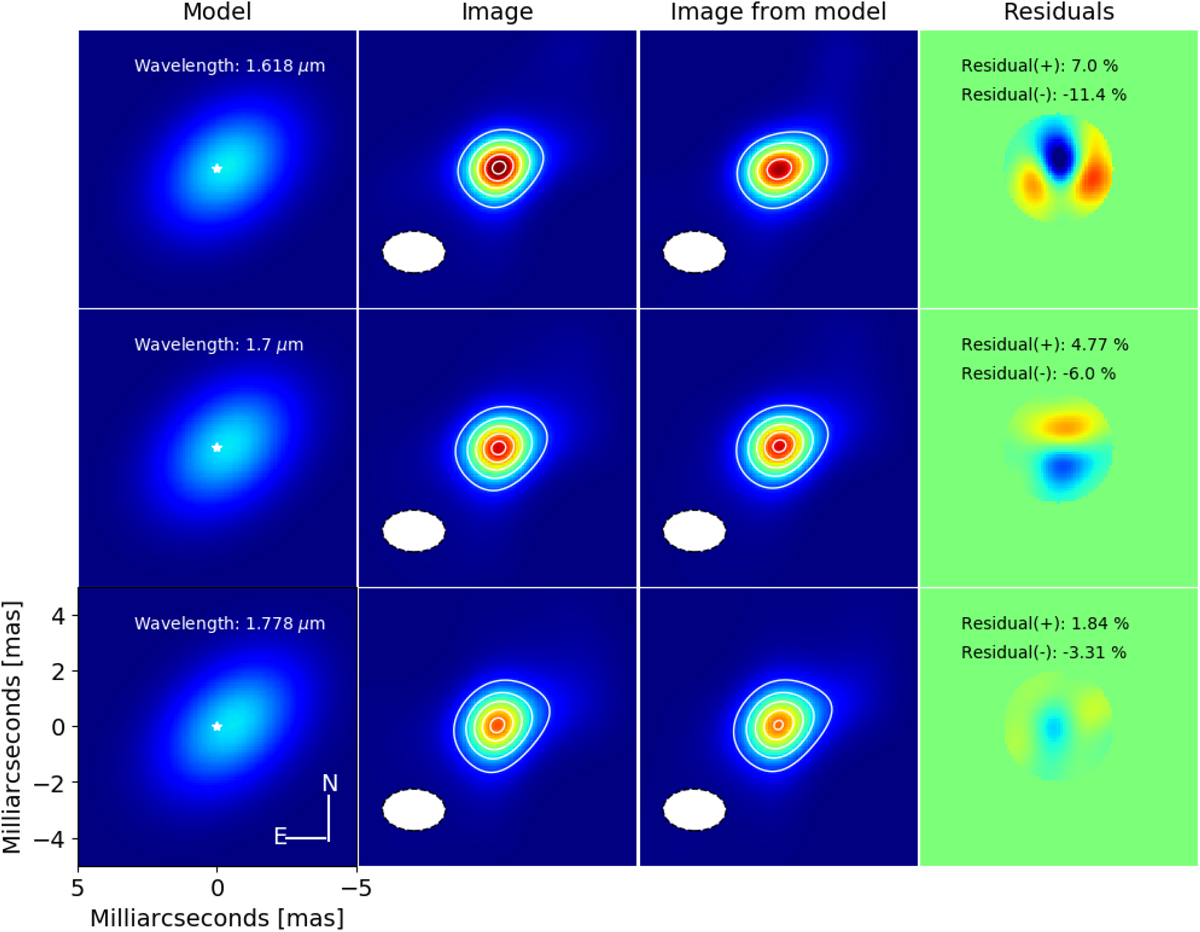
BiSpectrum Maximum Entropy Method (BSMEM) reconstructed images for our 2013 PIONIER epoch and the best-fit Gaussian model. The first column displays maps of the best-fit parametric models and the second column corresponds to the images recovered from the data at the corresponding epoch and wavelength. The third column shows reconstructed images from synthetic data using the indicated best-fit model. The fourth column displays the residuals between thereconstructed images from the data and the ones from the best-fit models. The wavelength for each row is labeled on the panels of the first column. The white ellipse in the second and third column corresponds to the synthesized beam (at FWHM). The white contours in the images of the second and third columns correspond to 20%, 40%, 60%, 80%, and 95% of the image’s peak. The maximum and minimum values labeled in the fourth column show the relative percentage of the (positive and negative) residuals and the peak relative to the reconstructed image from the data.
Current usage metrics show cumulative count of Article Views (full-text article views including HTML views, PDF and ePub downloads, according to the available data) and Abstracts Views on Vision4Press platform.
Data correspond to usage on the plateform after 2015. The current usage metrics is available 48-96 hours after online publication and is updated daily on week days.
Initial download of the metrics may take a while.