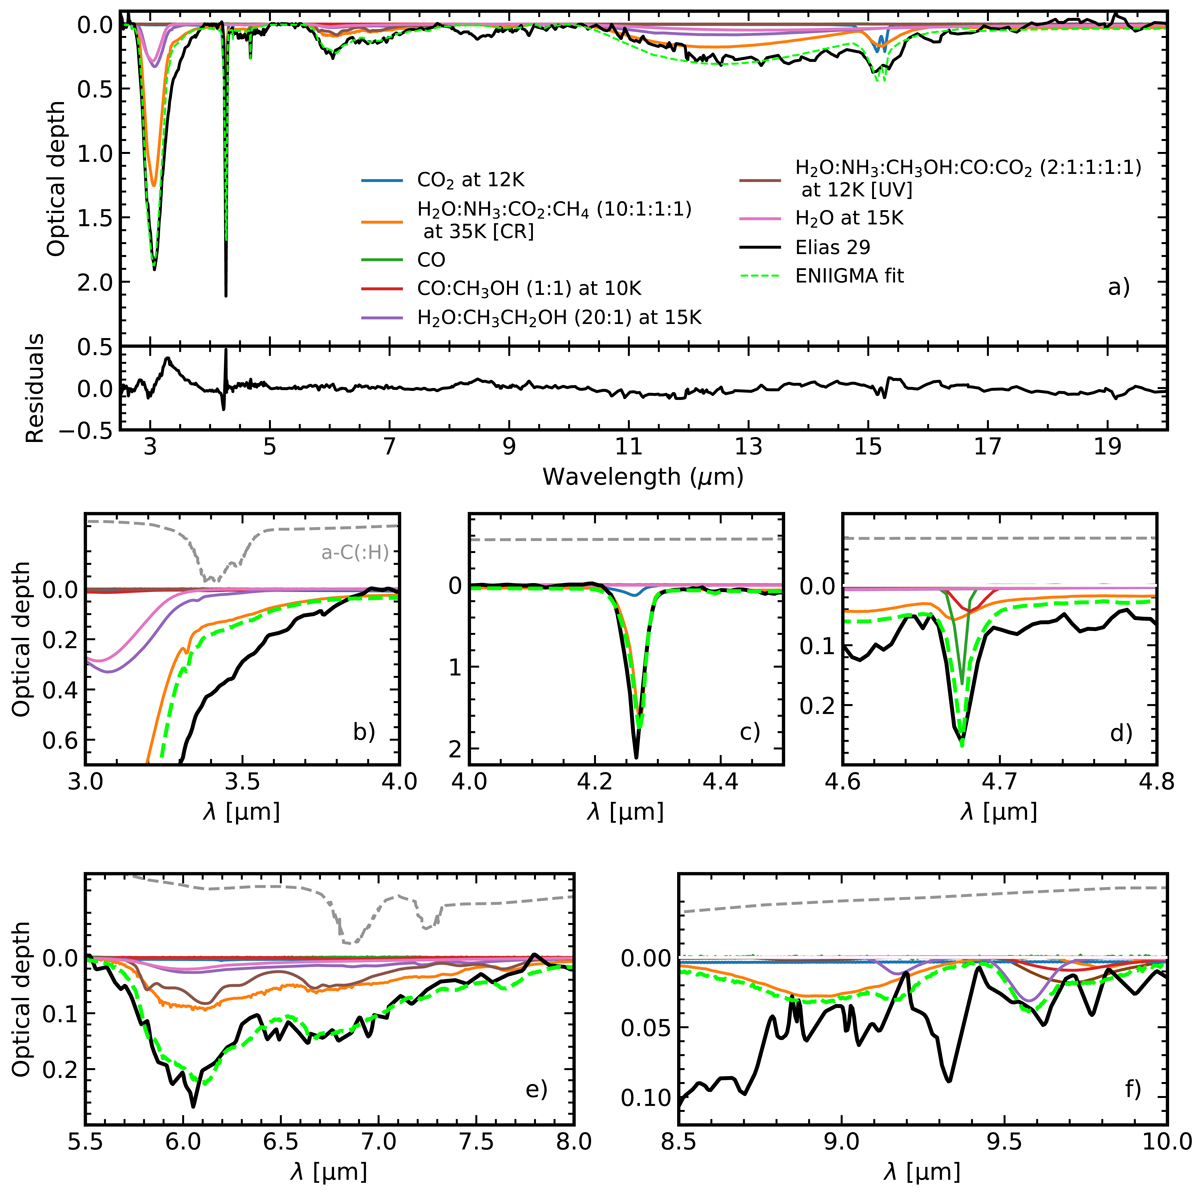
Fig. 17.
Download original image
Spectral decomposition of the mid-IR spectrum of Elias 29 protostar. a: optical depth scale of the observed spectrum between 2.5 and 20 μm, and the seven ice components used to fit the observed spectrum. The best fit is shown by the dashed green line. The residual spectrum is shown below this panel. b–f: zoom onto short spectral ranges highlighting the contribution of small features. In these plots, the spectral features of amorphous carbon, a−C(:H), that were not used in the spectral decomposition are shown by the dashed grey lines above the Elias 29 spectrum and the ice data components. This illustrates a potential contribution of features other than vibrational modes of ice species. Panel b: L-band red wing absorption excess that is not entirely reproduced by the ice components (see Sect. 4.2). Panels c and d: CO2 and CO features. Panel e: important contributions of UV and cosmic-ray processed samples. Finally, panel f highlights the contribution of the broad NH3 ice feature at 9 μm, CH3CH2OH at 9.6 μm, and CH3OH at 9.8 μm.
Current usage metrics show cumulative count of Article Views (full-text article views including HTML views, PDF and ePub downloads, according to the available data) and Abstracts Views on Vision4Press platform.
Data correspond to usage on the plateform after 2015. The current usage metrics is available 48-96 hours after online publication and is updated daily on week days.
Initial download of the metrics may take a while.