Fig. 15.
Download original image
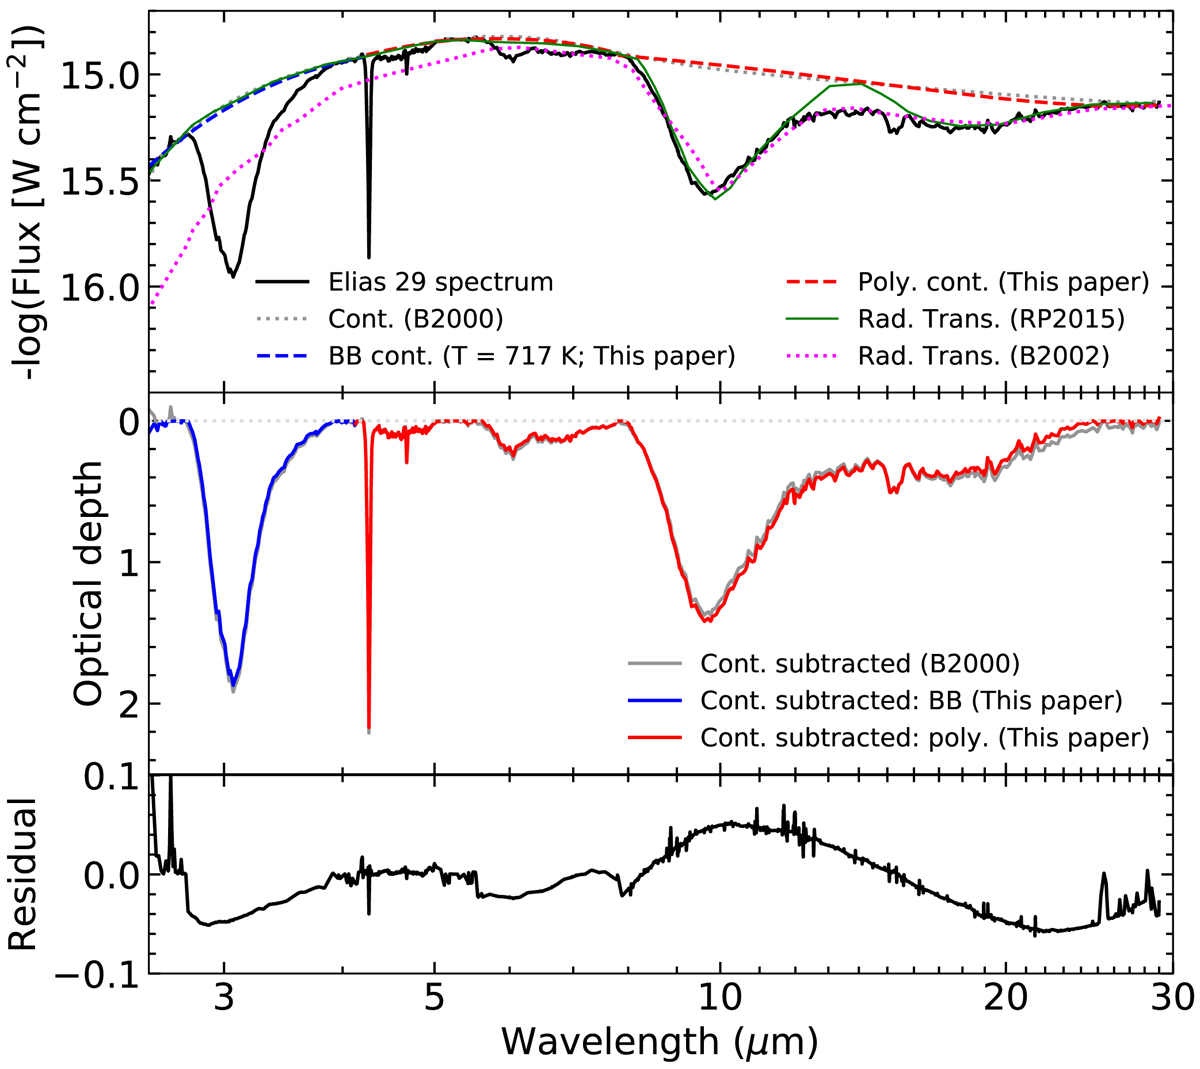
Continuum determination and optical depth calculation of the Elias 29 spectrum. Top: blue and red dashed lines show the blackbody and polynomial continuum calculation used in this paper, respectively. The grey dotted line shows the continuum determination from Boogert et al. (2000), which is similar to the continuum in the present paper. The dotted magenta line is the continuum calculation with radiative transfer modelling from Boogert et al. (2002). The green solid line is the continuum calculation with radiative transfer modelling from Rocha & Pilling (2015). In both cases, the silicate feature is redshifted in the models compared with the observations. Middle: grey line shows the optical depth scale of Elias 29 spectrum adopting the continuum from Boogert et al. (2000), whereas the blue and red lines show the same by respectively adopting blackbody and polynomial continuum derived in this paper. Bottom: difference between optical depth estimates from this paper and those in Boogert et al. (2000).
Current usage metrics show cumulative count of Article Views (full-text article views including HTML views, PDF and ePub downloads, according to the available data) and Abstracts Views on Vision4Press platform.
Data correspond to usage on the plateform after 2015. The current usage metrics is available 48-96 hours after online publication and is updated daily on week days.
Initial download of the metrics may take a while.