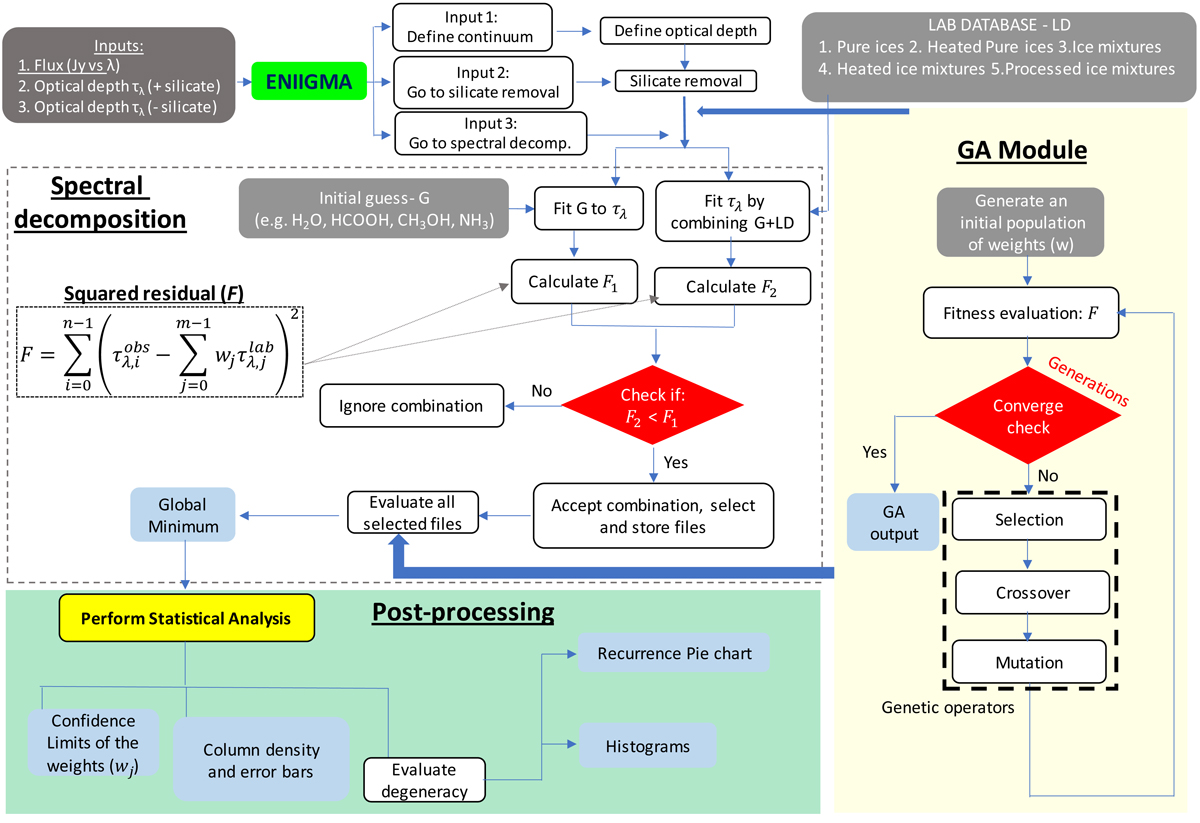
Fig. 1.
Download original image
Flowchart of the ENIIGMA fitting tool. The light grey dashed box highlights the steps during the spectral decomposition. The light yellow region highlights the Genetic Algorithm (GA) module, whereas the light green region shows the steps performed during the post-processing statistical analysis. The small grey boxes indicate the input data requested by the tool. Small blue boxes are the output data. White boxes indicate the processes performed in each step.
Current usage metrics show cumulative count of Article Views (full-text article views including HTML views, PDF and ePub downloads, according to the available data) and Abstracts Views on Vision4Press platform.
Data correspond to usage on the plateform after 2015. The current usage metrics is available 48-96 hours after online publication and is updated daily on week days.
Initial download of the metrics may take a while.