Fig. A.2.
Download original image
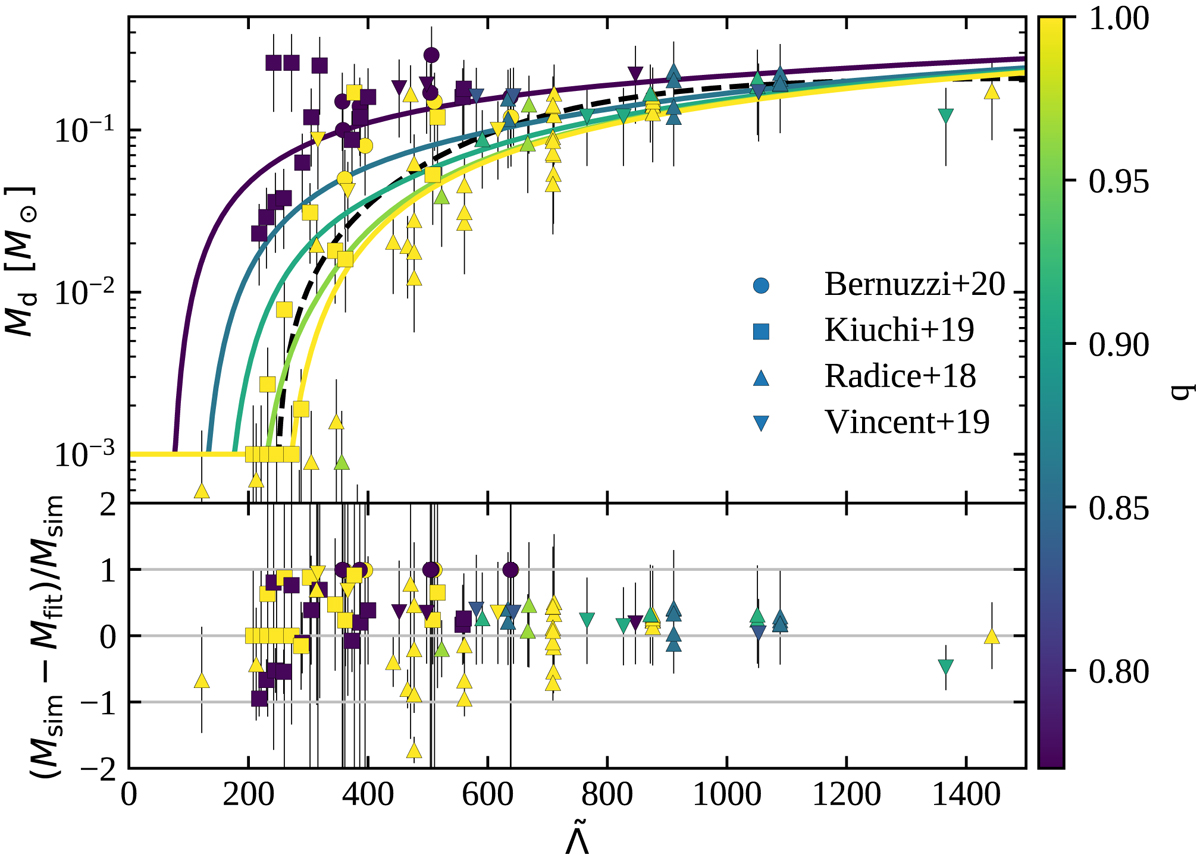
Comparison between disc masses from numerical relativity simulations and the predictions of our fitting formula (Eqs. A.3, A.4, and A.5). In both panels, data points show the disc masses reported in (Bernuzzi et al. 2020, squares), (Kiuchi et al. 2019, circles), (Radice et al. 2018a, upward-pointing triangles), and (Vincent et al. 2020, downward-pointing triangles) as a function of the dimensionless tidal deformability parameter ![]() of the corresponding NS binary. The colour of each marker shows the mass ratio q of the binary, as coded in the colour bar on the right. In the upper panel, solid lines show the predictions of our fitting formula, assuming a representative total mass of M1 + M2 = 3 M⊙. The dashed black line shows the fit from Radice et al. (2018a) for comparison. The lower panel shows the relative residuals between the fitting formula (evaluated with the appropriate total mass for each binary) and the results from the simulation. More details are provided in the text.
of the corresponding NS binary. The colour of each marker shows the mass ratio q of the binary, as coded in the colour bar on the right. In the upper panel, solid lines show the predictions of our fitting formula, assuming a representative total mass of M1 + M2 = 3 M⊙. The dashed black line shows the fit from Radice et al. (2018a) for comparison. The lower panel shows the relative residuals between the fitting formula (evaluated with the appropriate total mass for each binary) and the results from the simulation. More details are provided in the text.
Current usage metrics show cumulative count of Article Views (full-text article views including HTML views, PDF and ePub downloads, according to the available data) and Abstracts Views on Vision4Press platform.
Data correspond to usage on the plateform after 2015. The current usage metrics is available 48-96 hours after online publication and is updated daily on week days.
Initial download of the metrics may take a while.