Fig. 10.
Download original image
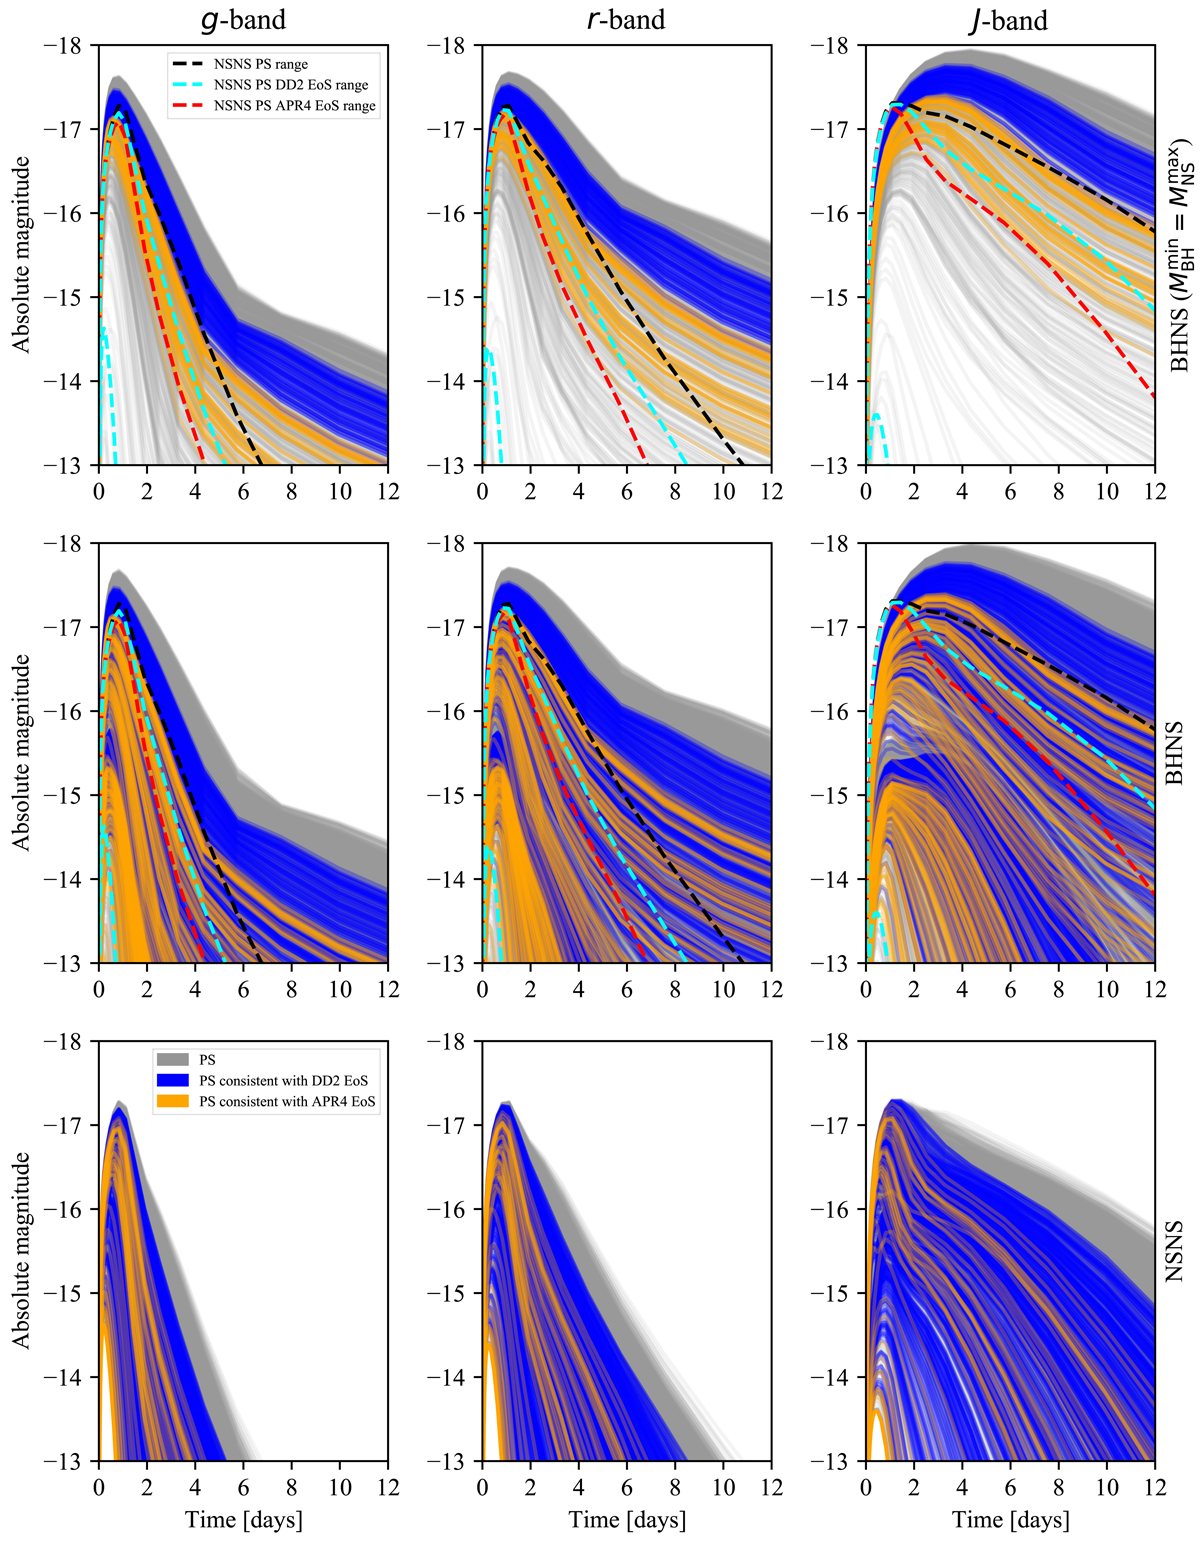
KN light curves for the GW190425 posterior samples. Top row: samples consistent with BHNS mergers (assuming ![]() ). Central row: all samples, considering that the primary object is a BH. Bottom row: samples consistent with NSNS mergers. Blue and orange lines indicate samples consistent with the EoSs DD2 and APR4, respectively. Dashed black, aqua, and red lines in the first two rows indicate the NSNS KN ranges for, respectively, all EoSs, DD2, and APR4. We consider the g-band (left column), r-band (central column), and J-band (right column).
). Central row: all samples, considering that the primary object is a BH. Bottom row: samples consistent with NSNS mergers. Blue and orange lines indicate samples consistent with the EoSs DD2 and APR4, respectively. Dashed black, aqua, and red lines in the first two rows indicate the NSNS KN ranges for, respectively, all EoSs, DD2, and APR4. We consider the g-band (left column), r-band (central column), and J-band (right column).
Current usage metrics show cumulative count of Article Views (full-text article views including HTML views, PDF and ePub downloads, according to the available data) and Abstracts Views on Vision4Press platform.
Data correspond to usage on the plateform after 2015. The current usage metrics is available 48-96 hours after online publication and is updated daily on week days.
Initial download of the metrics may take a while.