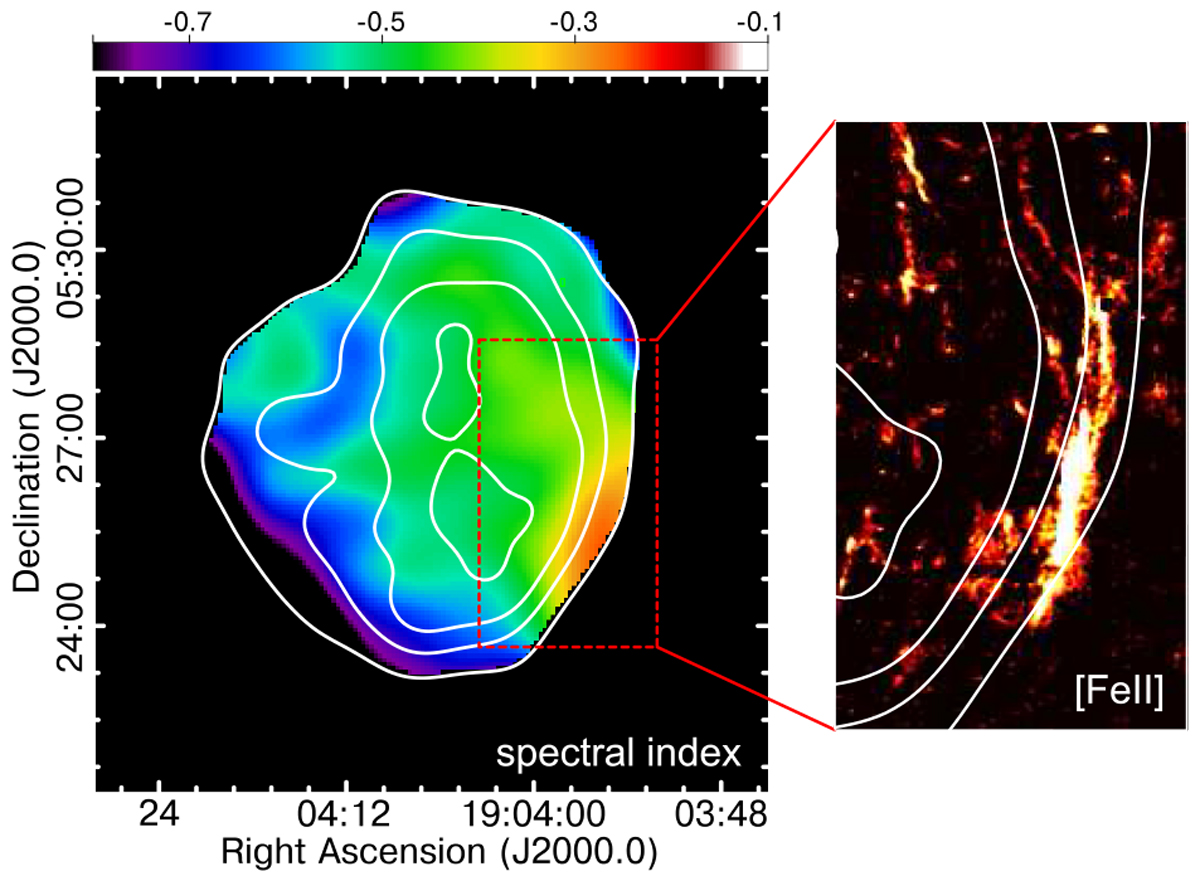
Fig. 8
Download original image
Absorption by associated ionised gas in the SNR 3C 396. Comparison between the 74 MHz/1.4 GHz radio spectral index distribution over 3C 396 (the same displayed in Fig. 2) and the filaments emitting in ionic iron line emission (image kindly provided by Dr. Lee, Y.-H.). The flattest spectral index feature is located where the bright [FeII] near-IR filaments are observed. Contours from the 74-MHz VLSSr image at levels 0.64, 1.7, 2.5, and 3.6 Jy beam−1 are included for reference.
Current usage metrics show cumulative count of Article Views (full-text article views including HTML views, PDF and ePub downloads, according to the available data) and Abstracts Views on Vision4Press platform.
Data correspond to usage on the plateform after 2015. The current usage metrics is available 48-96 hours after online publication and is updated daily on week days.
Initial download of the metrics may take a while.