Fig. 7
Download original image
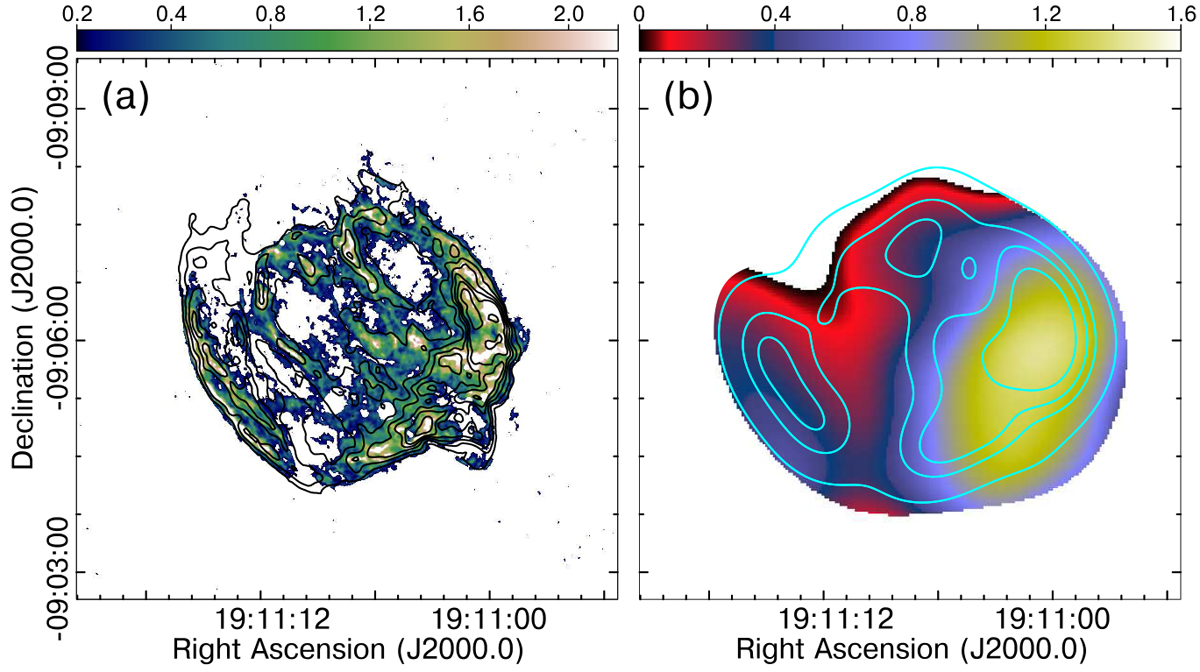
Absorption by associated ionised gas in the SNR W49B. Panel a: [FeII] line emission at 1.644 μm towards W49B (image kindly provided by Dr. Lee, Y.-H.) overlaid with contours (levels: 3, 10, 20, 30, 40, 50, and 60 mJy beam−1) of the 1.4 GHz continuum radiation detected in the MAGPIS survey. The colour representation is linear in units of MJy sr−1. Panel b: local distribution of the optical depth computed towards W49B at 74 MHz. Cyan contours of the near-IR [FeII] line emission matched at the 45′′ resolution are superimposed for comparison, with levels at 12, 47, 70, and 105 MJy sr−1.
Current usage metrics show cumulative count of Article Views (full-text article views including HTML views, PDF and ePub downloads, according to the available data) and Abstracts Views on Vision4Press platform.
Data correspond to usage on the plateform after 2015. The current usage metrics is available 48-96 hours after online publication and is updated daily on week days.
Initial download of the metrics may take a while.