Fig. 6
Download original image
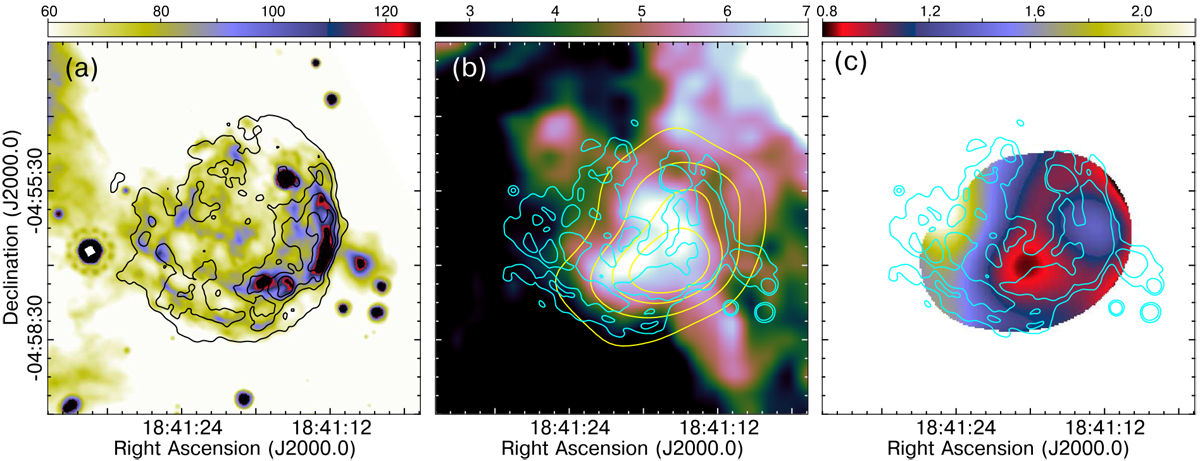
Absorption by associated ionised gas in the SNR Kes 73. Panel a: Spitzer MIPSGAL 24 μm image for Kes 73 (shown with a linear colour scale in MJy sr−1) overlaid with black contours tracing 1.4 GHz radio continuum emission at levels 2.5, 4.8, 7.6, and 11 mJy beam−1 from the MAGPIS survey. The morphology of the IR emission strongly mimics the radio emission. Panel b: 13CO (1–0) data from GRS integrated in the vLSR = 95–105 km s−1 range. The linear colour scale is in K km s−1. Cyan and yellow contours represent the mid-IR (levels: 70 and 84 MJy sr−1) and 74 MHzlow-radio frequency intensities (levels: 0.8, 1.3, 1.8, and 2.2 Jy beam−1), respectively.The newly-identified CO cloud is detected within the boundaries of the Kes 73 shell. Panel c: optical depth towards Kes 73 at 74 MHz as a function of position. Cyan contours superimposed delineate the mid-IR emission as in panel b.
Current usage metrics show cumulative count of Article Views (full-text article views including HTML views, PDF and ePub downloads, according to the available data) and Abstracts Views on Vision4Press platform.
Data correspond to usage on the plateform after 2015. The current usage metrics is available 48-96 hours after online publication and is updated daily on week days.
Initial download of the metrics may take a while.