Fig. 5
Download original image
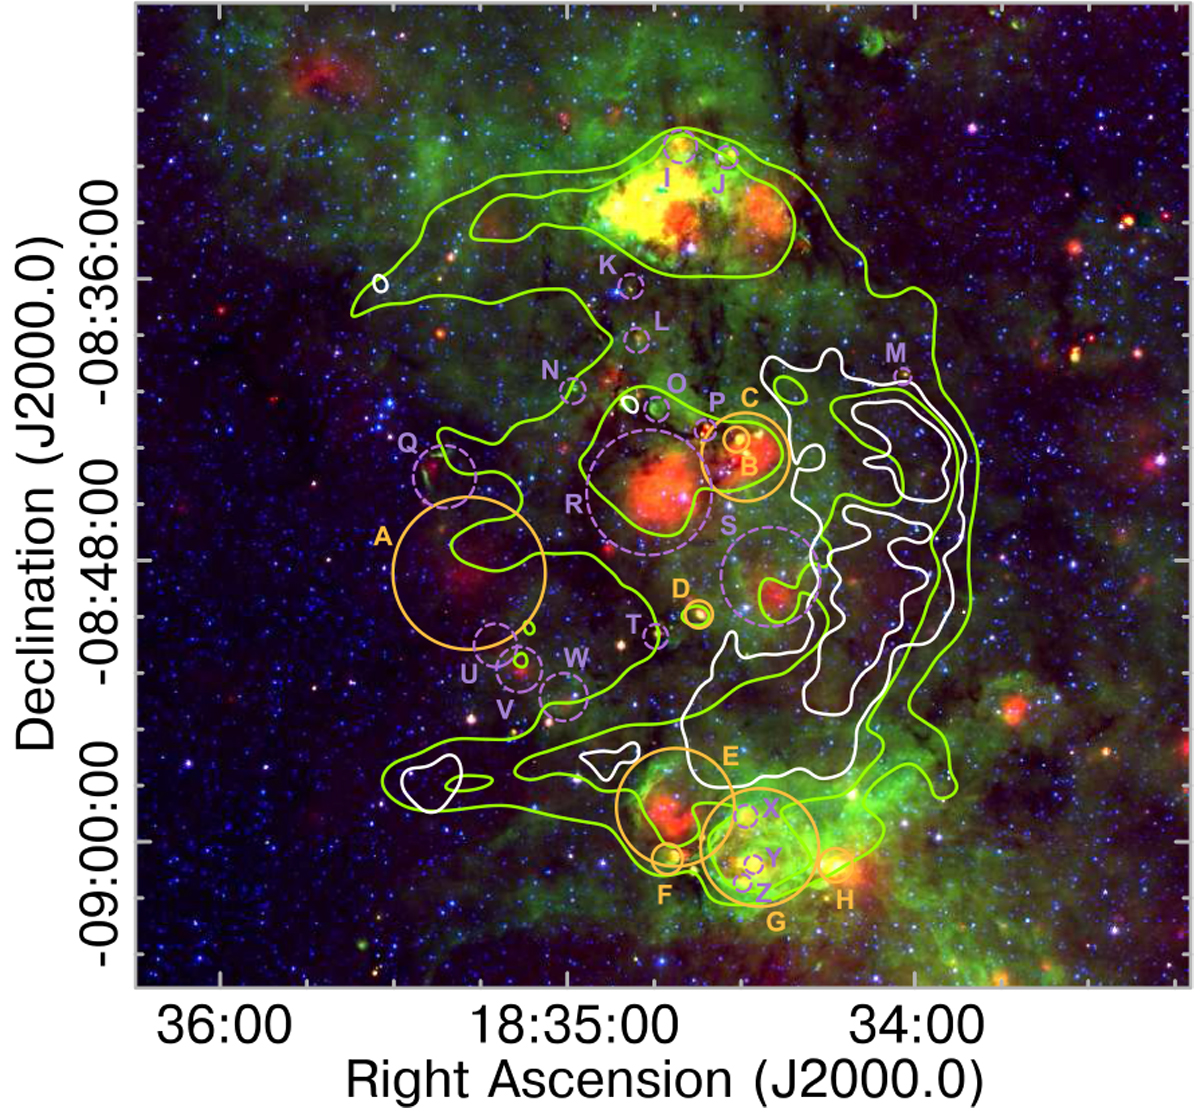
Absorption by associated ionised gas in the SNR W41. Spitzer 3-colour image (RGB: 24, 8.0, and 3.6 μm) towards the W41’s complex with contours of radio continuum emission overlaid. Green contours (at 0.25 and 0.42 Jy beam−1 levels) correspond to the 1.4 GHz image from MAGPIS, convolved to match the VLSSr resolution of 75′′. VLSSr 74 MHz continuum contours are superimposed in white (levels: 0.56 and 1.30 Jy beam−1). Multiple H IIregions, A-H, in the field with known distances near W41 (~5 kpc) are marked by orange circles, while thermal sources (I-Z) with unknown distance are indicated by dashed violet circles (Anderson et al. 2014).
Current usage metrics show cumulative count of Article Views (full-text article views including HTML views, PDF and ePub downloads, according to the available data) and Abstracts Views on Vision4Press platform.
Data correspond to usage on the plateform after 2015. The current usage metrics is available 48-96 hours after online publication and is updated daily on week days.
Initial download of the metrics may take a while.