Fig. 4
Download original image
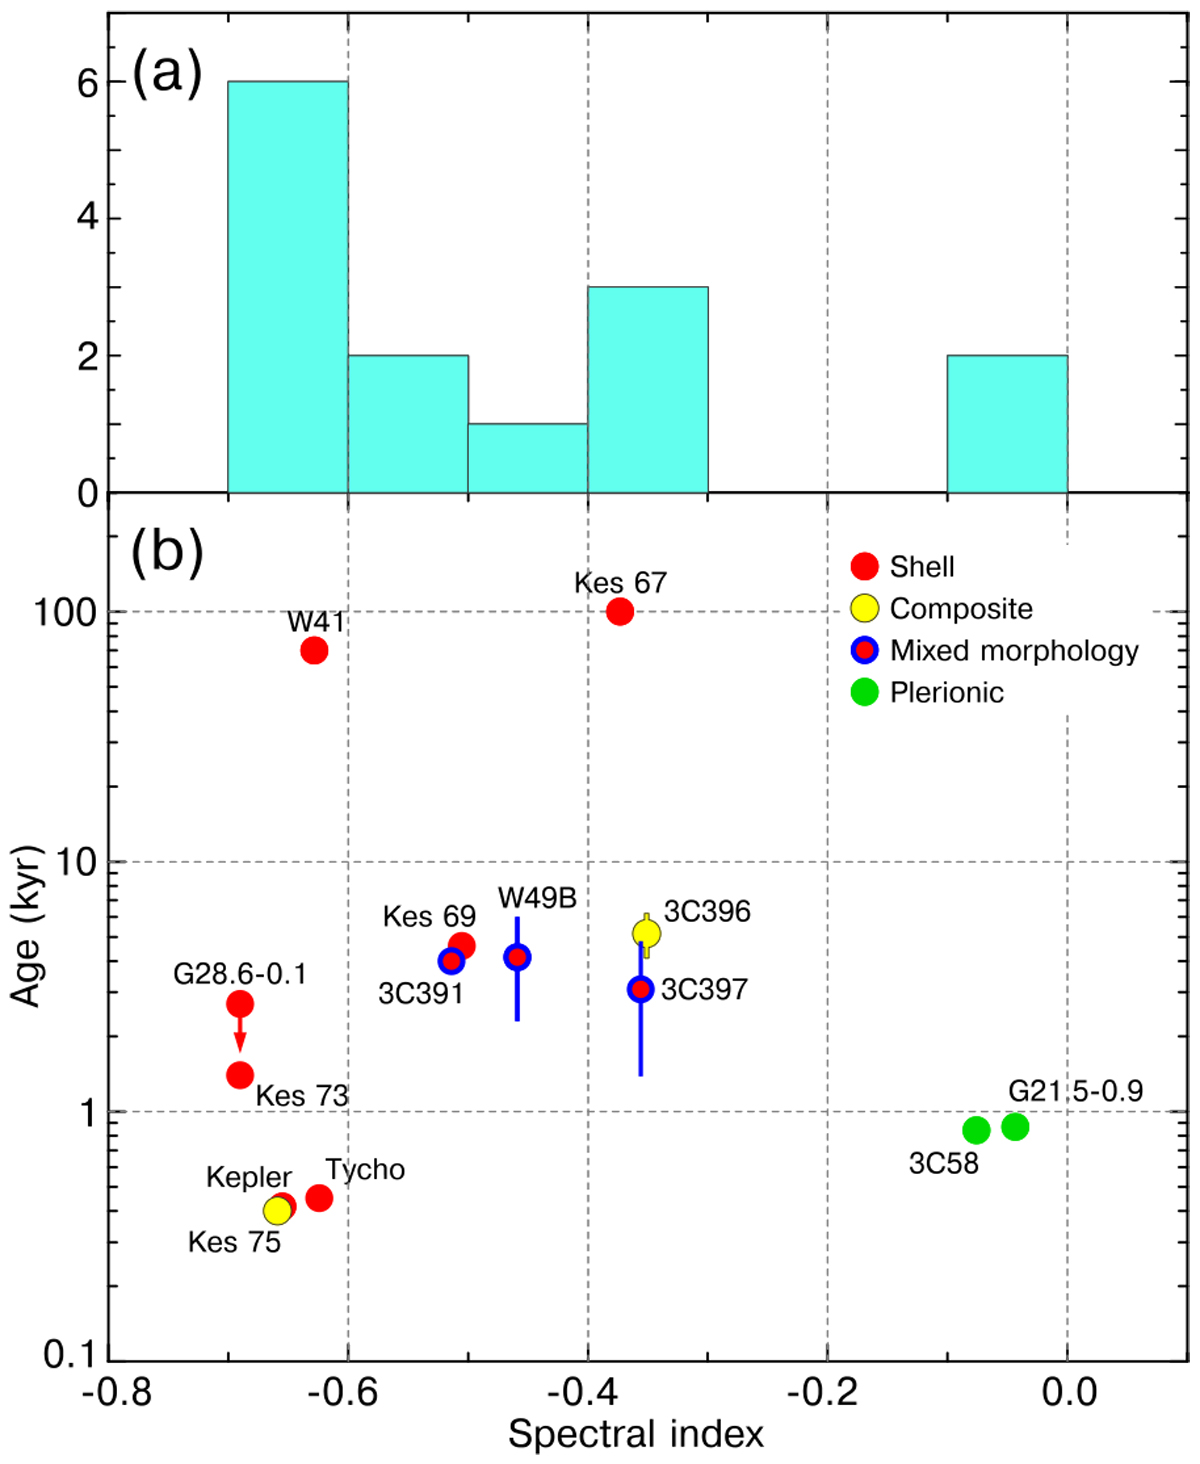
SNR radio continuum spectral indices and ages. Panel a: histogram of the spectral indices as inferred from the weighted fitting to the entire spectrum of each SNR in our study (Fig. 3). Panel b: distribution of the computed spectral index values according to the age and morphology of the source. The spectral indices for the younger (≲3000 yr) SNRs are steeper than −0.5, the canonical value in test-particle diffusive shock acceleration theory.
Current usage metrics show cumulative count of Article Views (full-text article views including HTML views, PDF and ePub downloads, according to the available data) and Abstracts Views on Vision4Press platform.
Data correspond to usage on the plateform after 2015. The current usage metrics is available 48-96 hours after online publication and is updated daily on week days.
Initial download of the metrics may take a while.