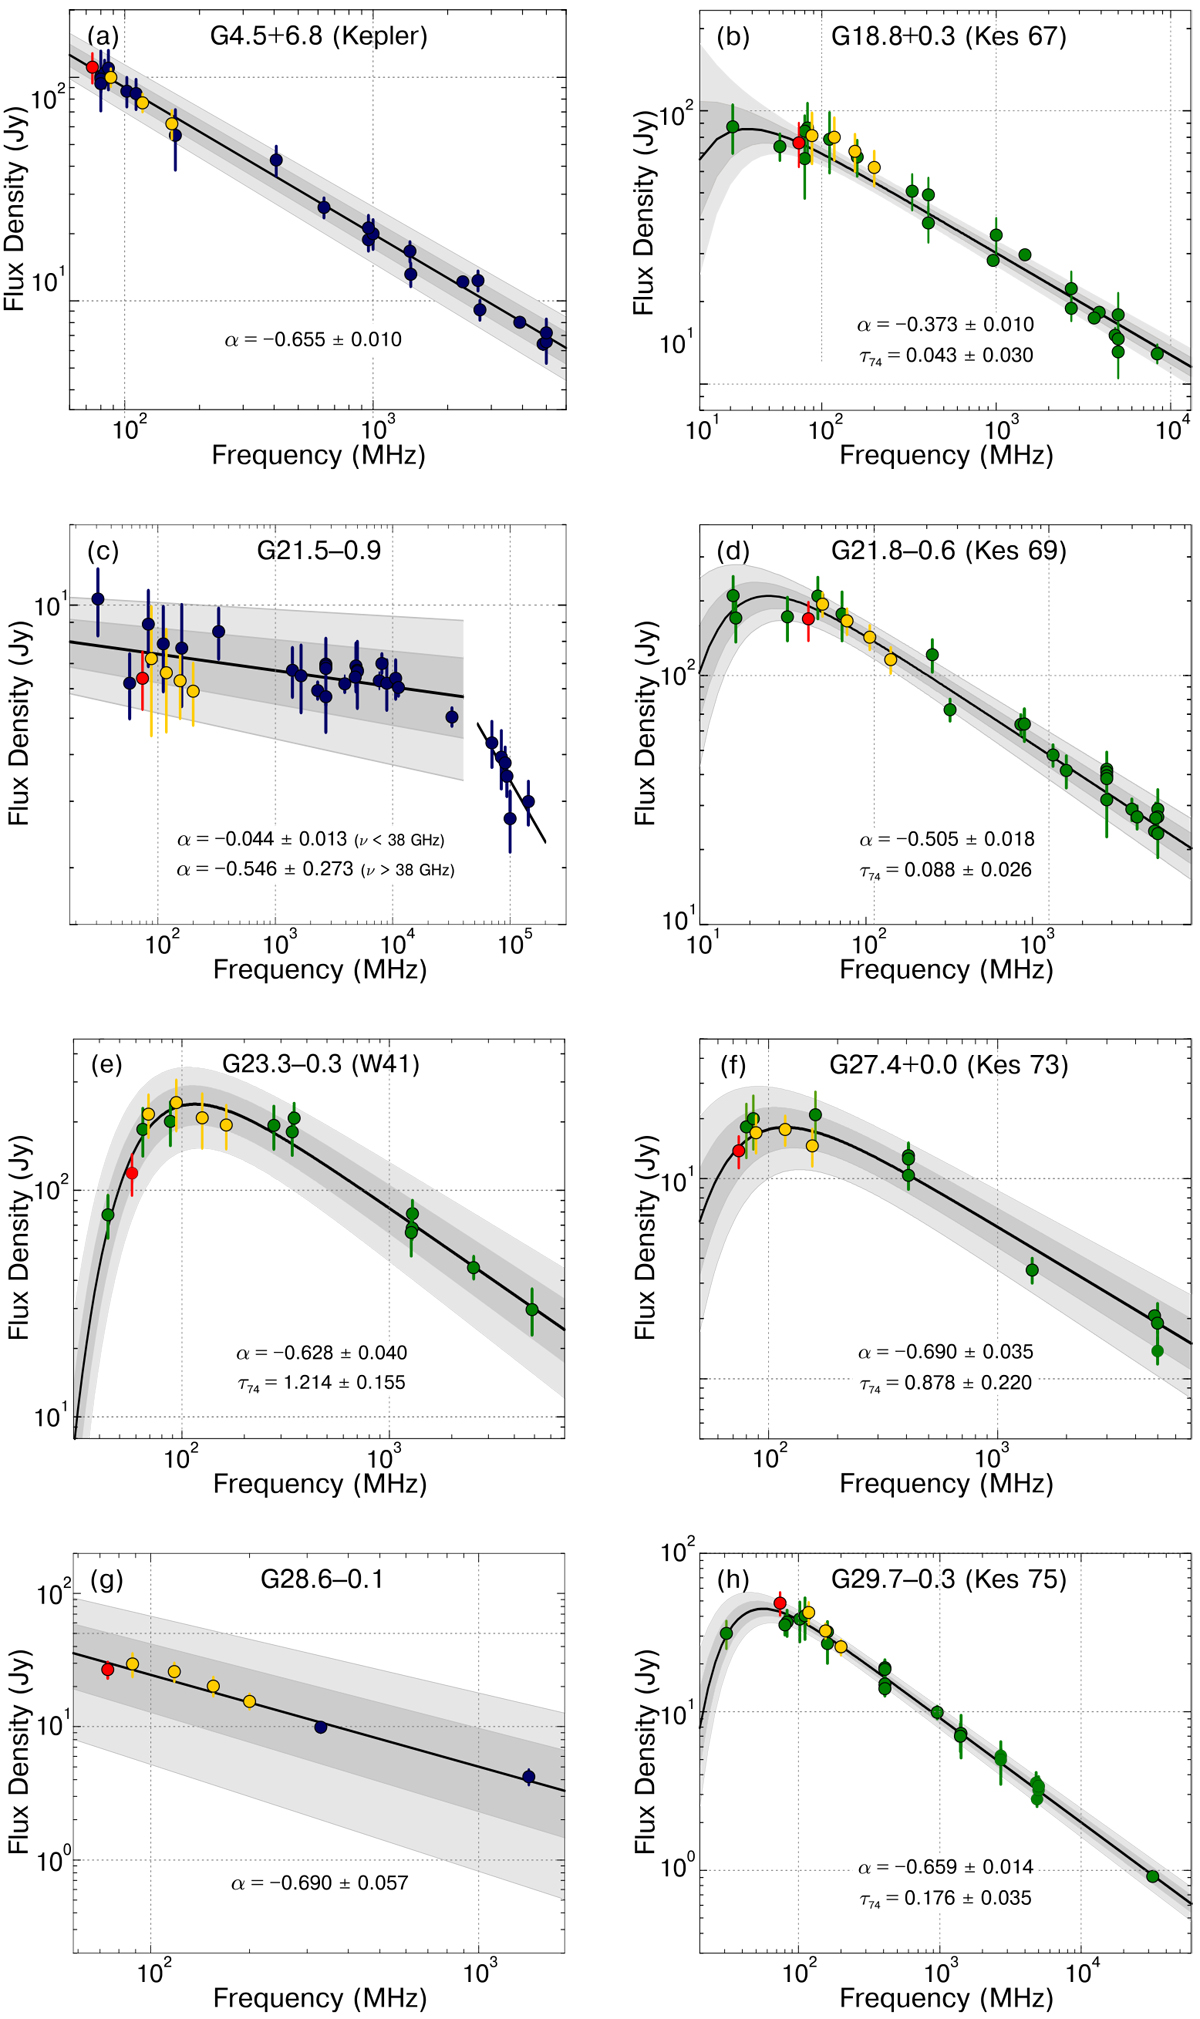
Fig. 3
Download original image
Revised integrated radio continuum spectra for the 14 SNRs in the VLSSr sample. In each spectrum the red filled circle indicates the new 74 MHz VLSSr flux density measurements, and the yellow ones the new GLEAM measurements. The remaining values are taken from the literature and plotted in blue or green depending on whethera single power law or a power law with a low-frequency turnover model was used to fit the data (see text for details). The solid line represents the best-fitting curve to the weighted data. Measurements were adjusted to the absolute flux density scale of Perley & Butler (2017). Gray-shaded bands represent the 1 and 2σ statistical uncertainty in the best-fit values of the spectral index α and the free-free optical depth τ74 (indicated in the lower portion of each panel, see also Table 3).
Current usage metrics show cumulative count of Article Views (full-text article views including HTML views, PDF and ePub downloads, according to the available data) and Abstracts Views on Vision4Press platform.
Data correspond to usage on the plateform after 2015. The current usage metrics is available 48-96 hours after online publication and is updated daily on week days.
Initial download of the metrics may take a while.