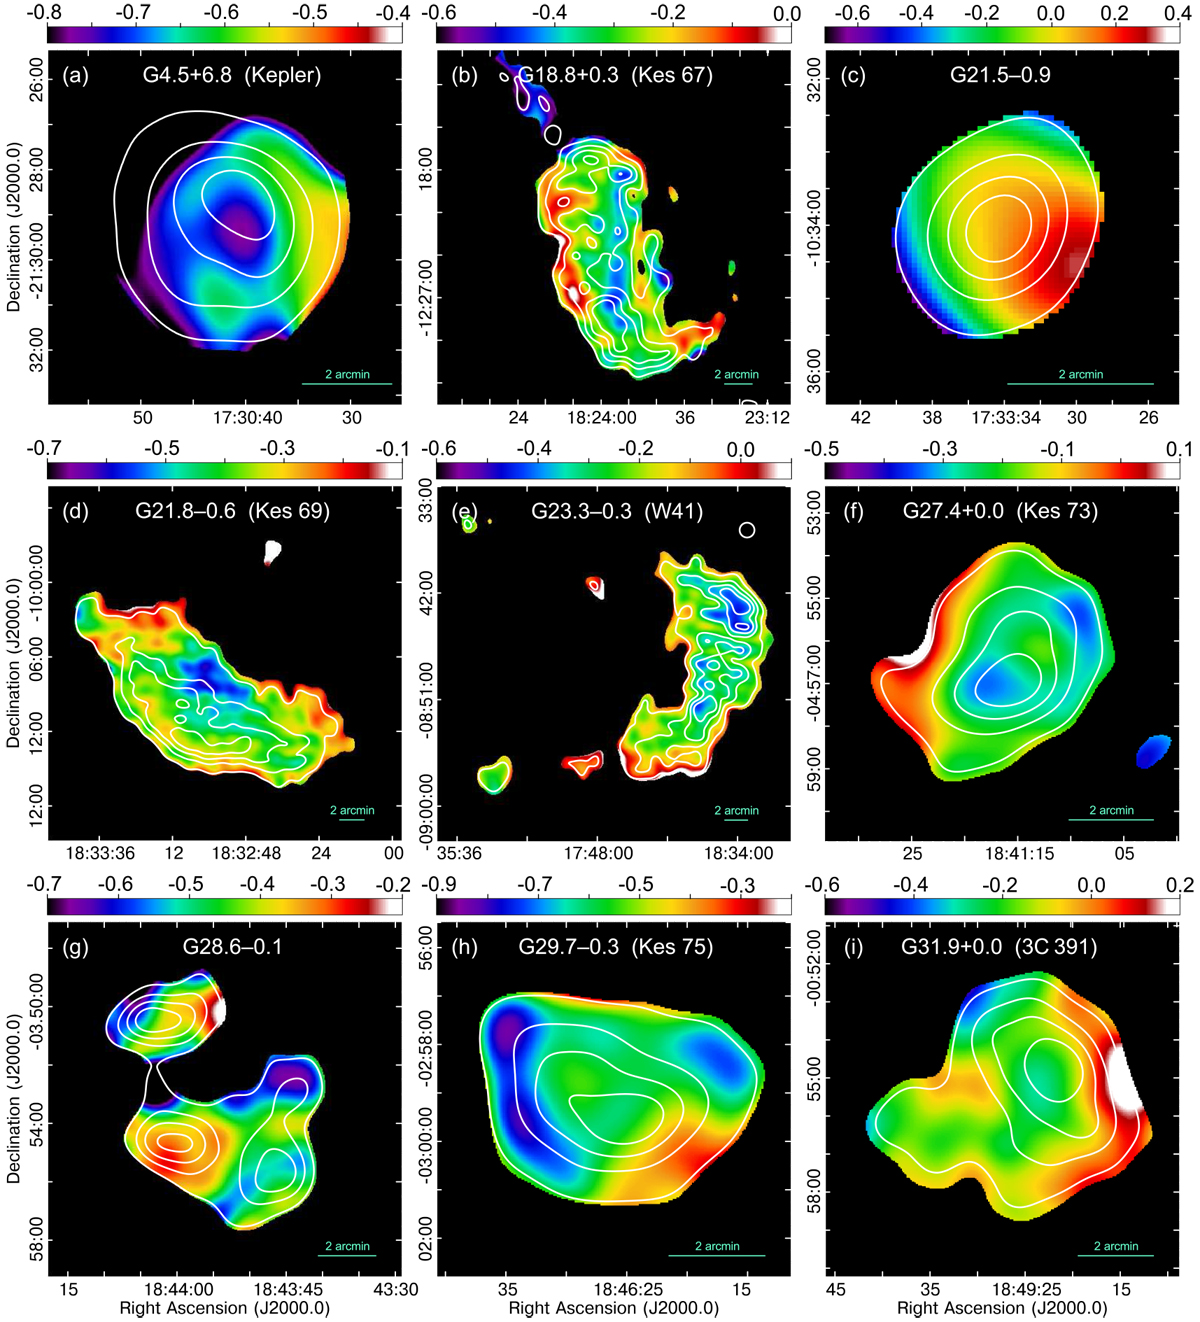
Fig. 2
Download original image
Spectral index maps between 74 MHz and 1.4 GHz (resolution 75′′) for the SNRs in our sample (except the source 3C 397). The maps were constructed by combining the VLSSr image with those available from radio continuum surveys (see text for details). Pixels with brightness below 4σ at 74 MHzor 1.4 GHz were blanked. The colour scales displayed at the top of the maps indicate the spectral indices measured over each SNRs. The radio continuum emission from VLSSr 74 MHz at a resolution of 75′′ is represented by contours. For reference, we used the same contours levels as in Fig. 1.
Current usage metrics show cumulative count of Article Views (full-text article views including HTML views, PDF and ePub downloads, according to the available data) and Abstracts Views on Vision4Press platform.
Data correspond to usage on the plateform after 2015. The current usage metrics is available 48-96 hours after online publication and is updated daily on week days.
Initial download of the metrics may take a while.