Fig. 1
Download original image
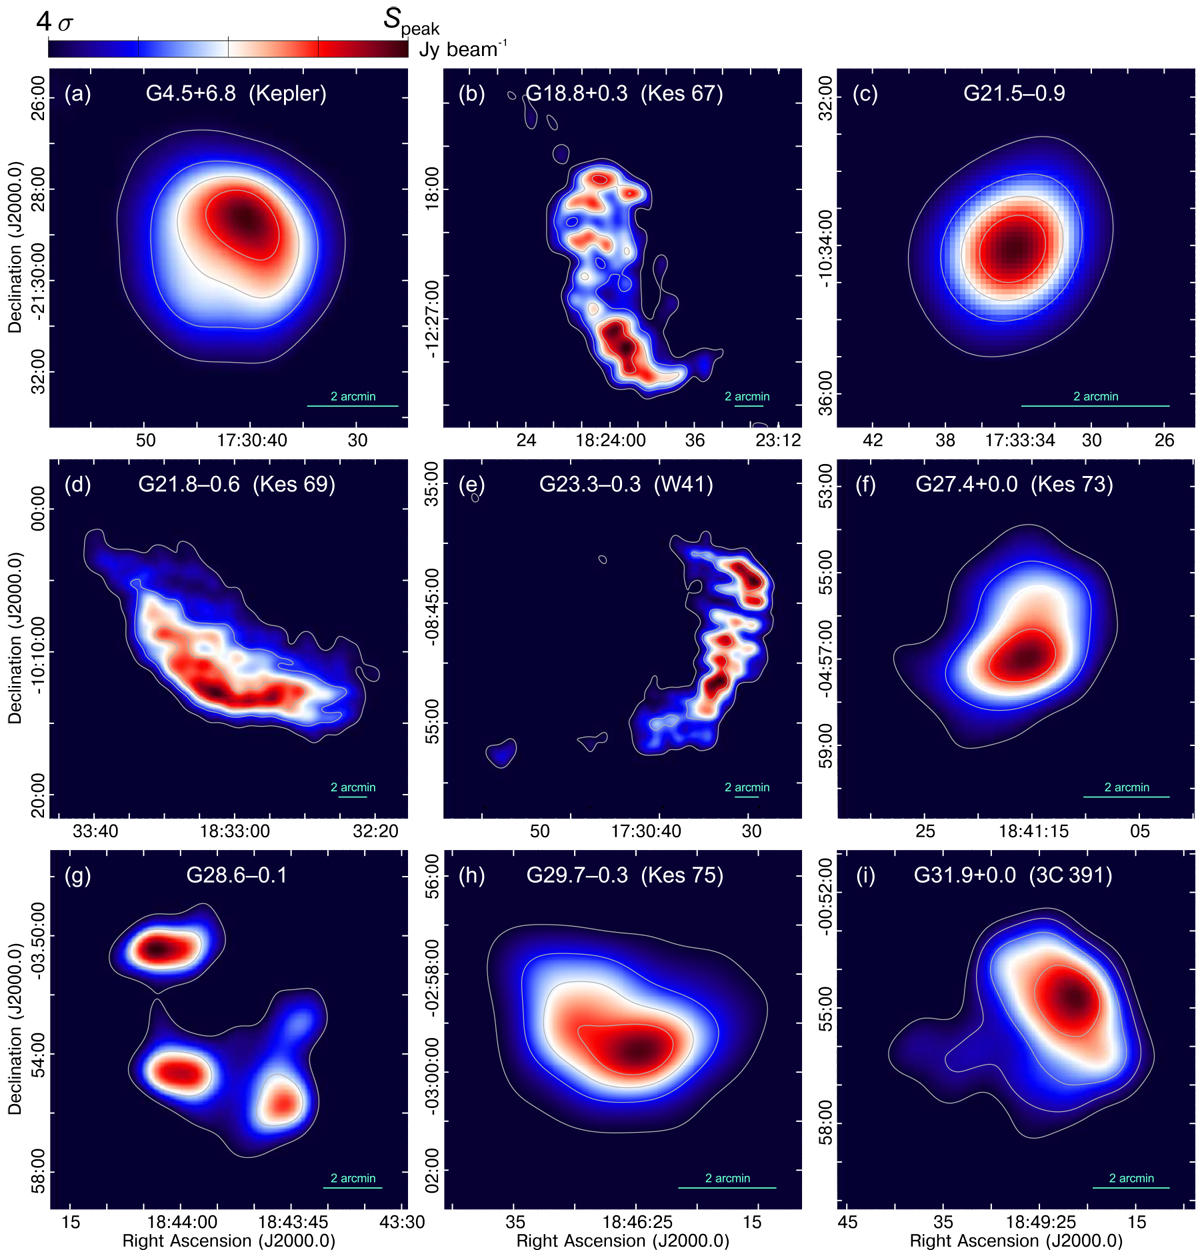
VLSSr 74 MHz images for the 14 SNRs in our sample, with an 75′′ angular resolution. The colour scale, given on top, is linear scaling from 4 times the local rms noise level (4σ) to the peak intensity value of the subimage, Speak (see values quoted in Table 1). The contours levels of the 74 MHz emission start at 4σ increasing in steps of 25, 50, and 75% of the scale range. Exceptions are Tycho and 3C 397 for which an 8σ lower limit was chosen. A cyan horizontal line of 2′ length is included in each panel to facilitate the comparison between the SNRs’ sizes.
Current usage metrics show cumulative count of Article Views (full-text article views including HTML views, PDF and ePub downloads, according to the available data) and Abstracts Views on Vision4Press platform.
Data correspond to usage on the plateform after 2015. The current usage metrics is available 48-96 hours after online publication and is updated daily on week days.
Initial download of the metrics may take a while.