Fig. 7
Download original image
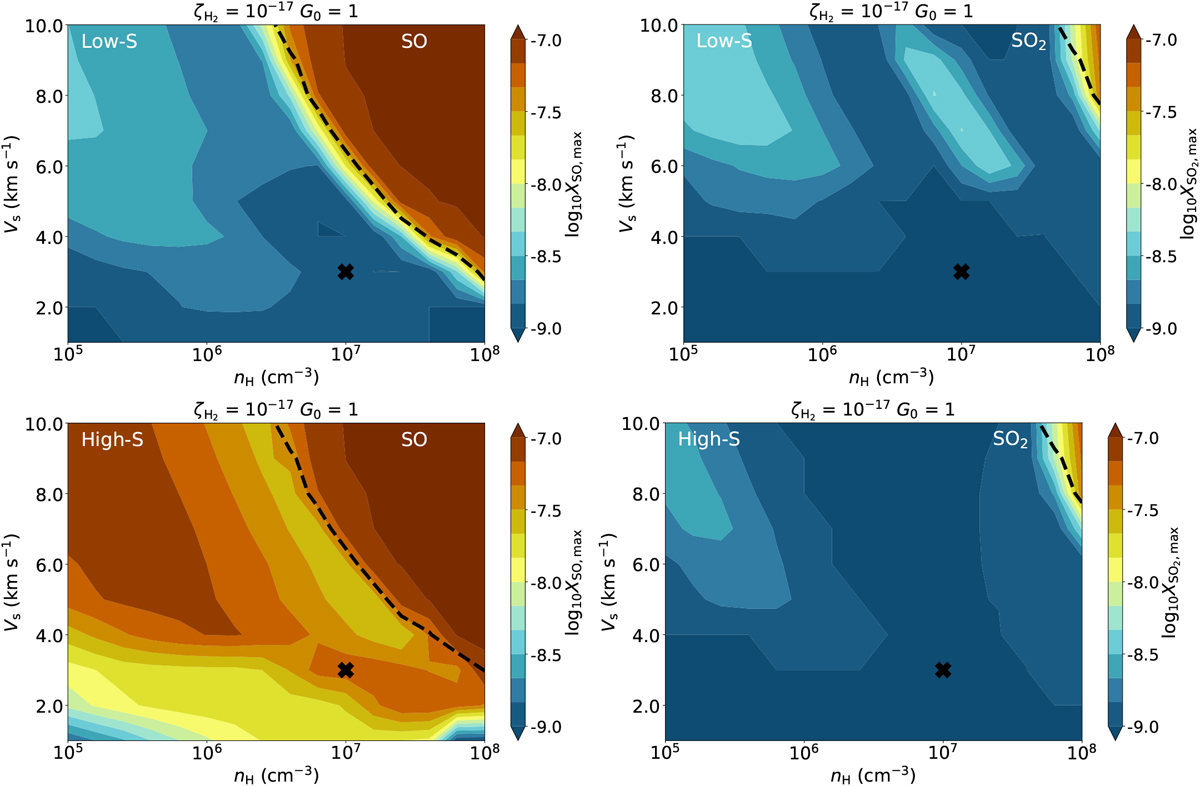
Maximum abundance reached (in color) of SO (left) and SO2 (right) in shock models as function of initial nH and Vs for an initial gas-phase atomic S abundance of 10−8 (top row) and 10−5 (bottom row). All other physical parameters are kept constant to the fiducial values and listed on top of the figure. The black cross indicates the position of the fiducial model. The dashed black line shows the ice line, i.e., where 50% of the ice is thermally desorbed into the gas in the shock.
Current usage metrics show cumulative count of Article Views (full-text article views including HTML views, PDF and ePub downloads, according to the available data) and Abstracts Views on Vision4Press platform.
Data correspond to usage on the plateform after 2015. The current usage metrics is available 48-96 hours after online publication and is updated daily on week days.
Initial download of the metrics may take a while.