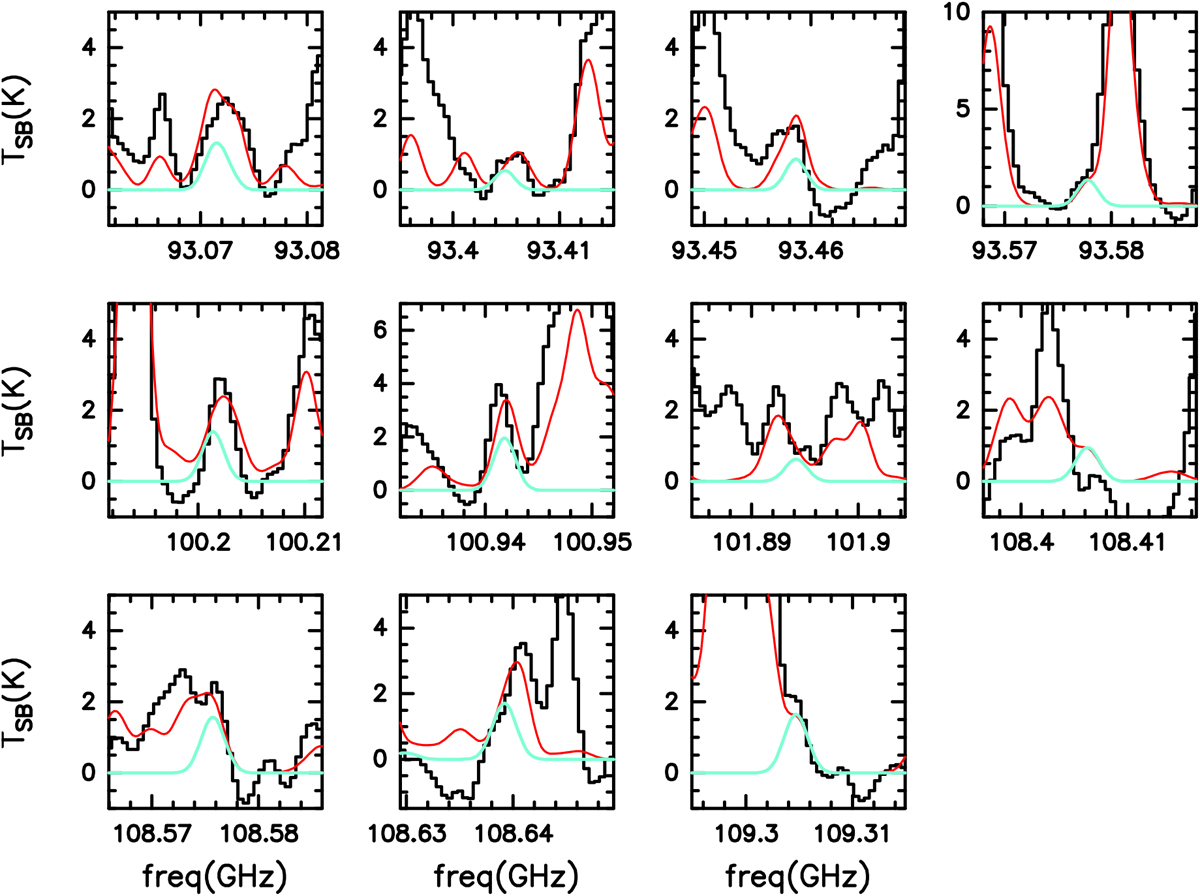
Fig. D.4
Download original image
Transitions listed in Table C.1 and used to fit 13CH3NCO. The turquoise curve represents the best LTE fit obtained with MADCUBA (Table 1). The red curve shows the simulated spectrum taking into account all the species identified so far in the region. Note that at 108.406 GHz the baselinederived from STATCONT is slightly high, and the simulated spectra do not match exactly the observed one.
Current usage metrics show cumulative count of Article Views (full-text article views including HTML views, PDF and ePub downloads, according to the available data) and Abstracts Views on Vision4Press platform.
Data correspond to usage on the plateform after 2015. The current usage metrics is available 48-96 hours after online publication and is updated daily on week days.
Initial download of the metrics may take a while.