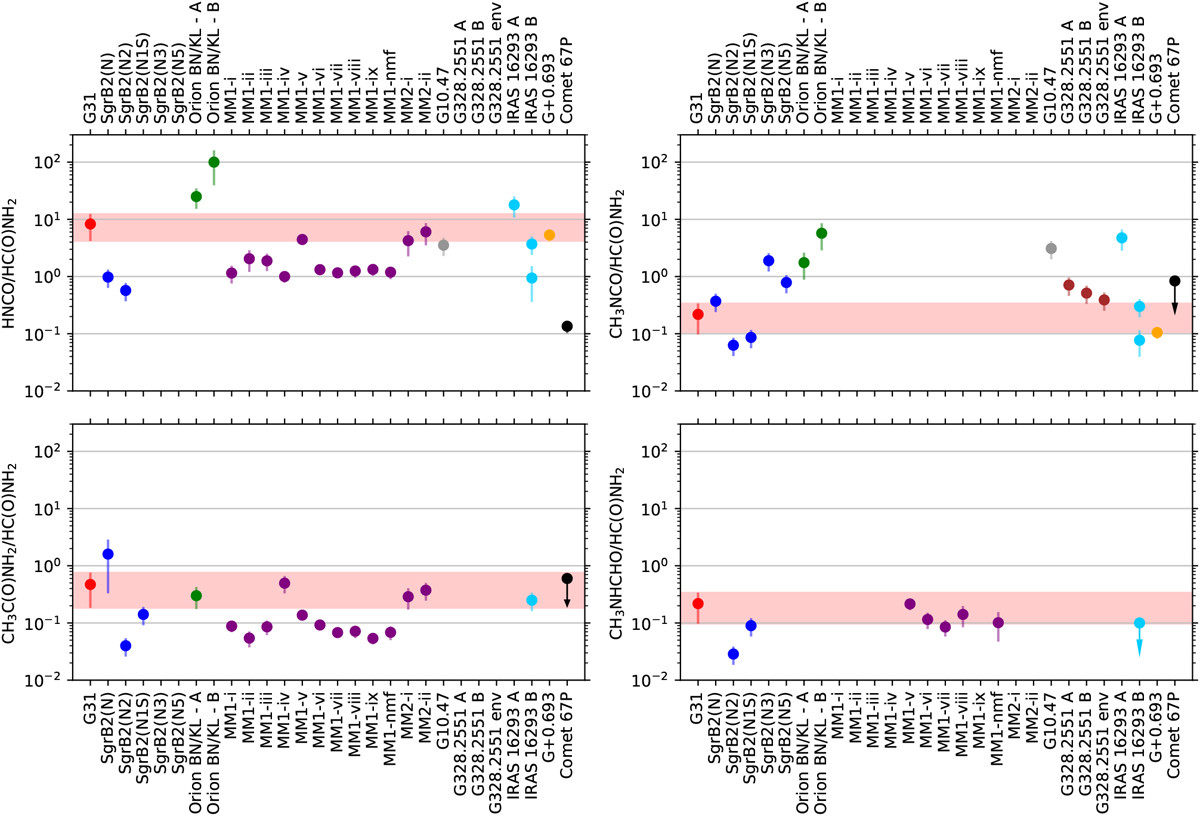
Fig. 18
Download original image
HNCO, CH3NCO, CH3C(O)NH2, and CH3NHCHO column density ratios with respect to HC(O)NH2 (upper-left, upper-right, bottom-left, and bottom-right panels, respectively) towards G31 (red points and shaded areas) and high- and low-mass star-forming regions, a GC molecular cloud, and the 67P comet (from the left to the right in all panels). Different colours represent: G31 in red, Sgr B2 in blue, Orion BN/KL in green, NGC 6334I in purple, G10.47 in grey, G328.2551 in brown, IRAS 16293 in light blue, G+0.693 in orange, and the comet 67P in black. Data are taken from: G31 (this work), Sgr B2(N) (Belloche et al. 2013), Sgr B2(N2) (Belloche et al. 2017), Sgr B2(N1S) (Belloche et al. 2019), Sgr B2(N3) and Sgr B2(N5) (Bonfand et al. 2019), Orion BN/KL - A and B (Cernicharo et al. 2016), NGC 6334I MM1-i–MM2ii (Ligterink et al. 2020), G10.47 (Gorai et al. 2020), G328.2551 A, B and env (Csengeri et al. 2019), IRAS 16293 A and B (Ligterink et al. 2017; Manigand et al. 2020; Ligterink et al. 2018; Martín-Doménech et al. 2017); G+0.693 (Zeng et al. 2018), and comet 67P (Altwegg et al. 2017) (from the left to the right).
Current usage metrics show cumulative count of Article Views (full-text article views including HTML views, PDF and ePub downloads, according to the available data) and Abstracts Views on Vision4Press platform.
Data correspond to usage on the plateform after 2015. The current usage metrics is available 48-96 hours after online publication and is updated daily on week days.
Initial download of the metrics may take a while.