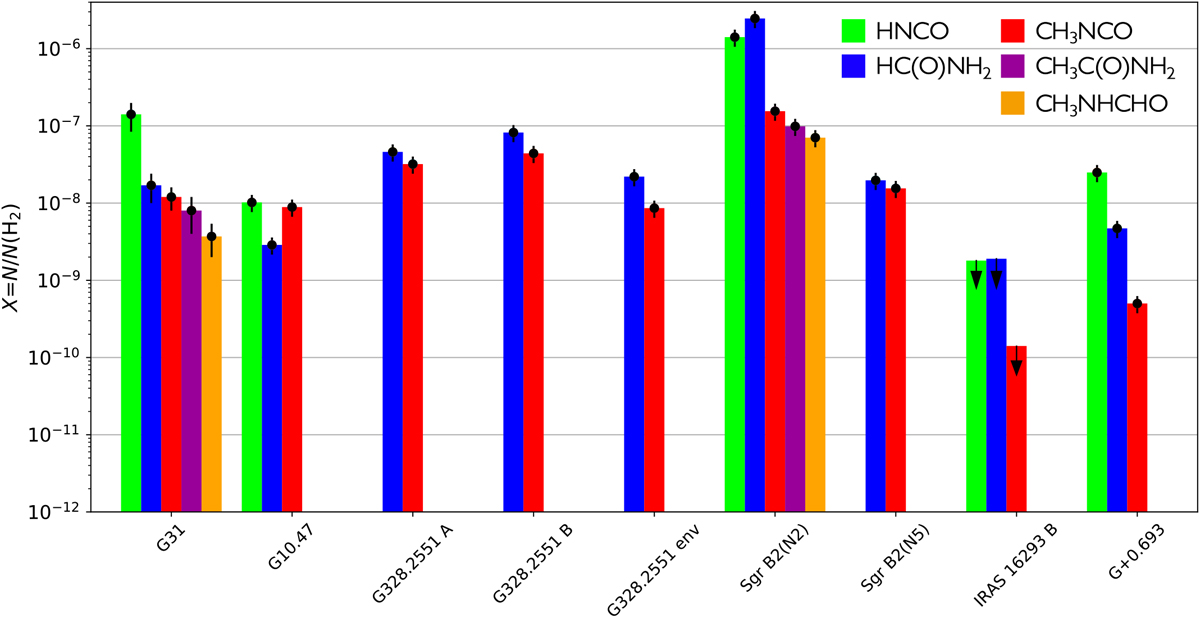
Fig. 14
Download original image
Molecular abundances (X) with respect to H2 towards G31, G10.47, G328.2551 A, B, and env, Sgr B2(N2), Sgr B2(N5), IRAS 16293 B (upper limits), and G+0.693. Different colours represent the different molecules for which the abundances are shown, as indicated in the legend in the upper-right corner. Data are taken from: G31 (this work), G10.47 (Gorai et al. 2020), G328.2551 (Csengeri et al. 2019), Sgr B2(N2) (Belloche et al. 2017), Sgr B2(N5) (Bonfand et al. 2019), IRAS 16293 B (Martín-Doménech et al. 2017), and G+0.693 (Zeng et al. 2018) (from the left to the right).
Current usage metrics show cumulative count of Article Views (full-text article views including HTML views, PDF and ePub downloads, according to the available data) and Abstracts Views on Vision4Press platform.
Data correspond to usage on the plateform after 2015. The current usage metrics is available 48-96 hours after online publication and is updated daily on week days.
Initial download of the metrics may take a while.