Fig. 13
Download original image
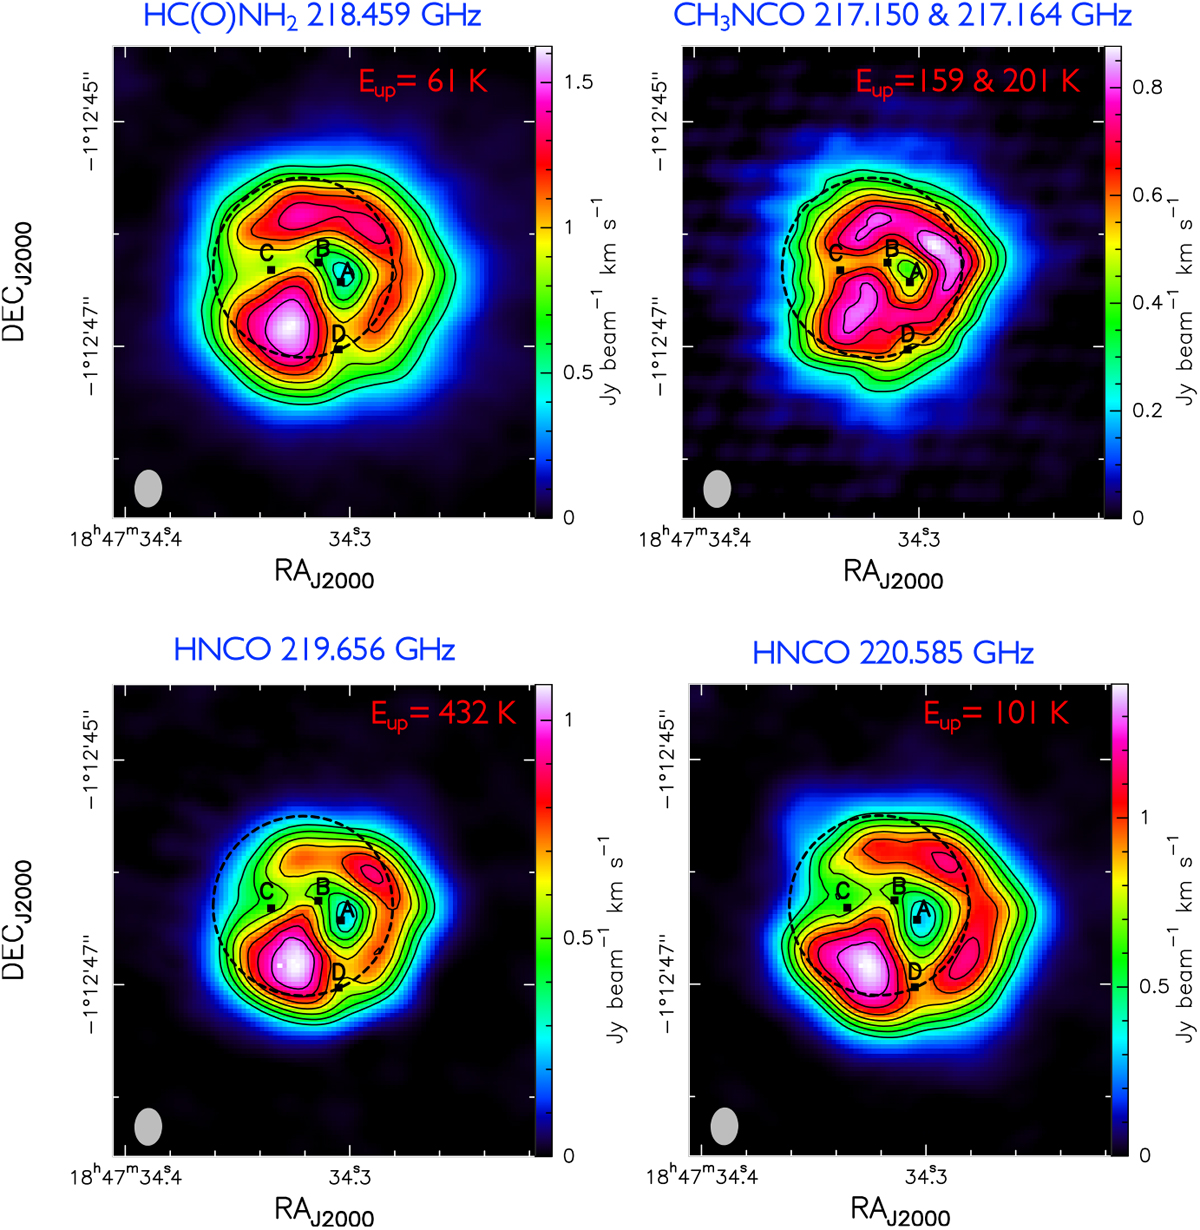
ALMA 0.′′2 resolution integrated emission maps at 1.4 mm of HC(O)NH2 (101,9–91,8) (top-left panel), CH3NCO (252,23,0–242,22,0 and 25−3,−,1–24−3,−,1) (top-right panel), HNCO (103,8–93,7 and 103,7–93,6) (bottom-left panel), and HNCO (101,9–91,8) (bottom-right panel) in a velocity range between 93 and 100 km s−1 for each transition. The contour levels are 0.3, 0.4, 0.5, 0.6, 0.7, 0.8, and 0.9 the maximum value of the maps. The maximum values of the maps are 1.625 Jy beam−1 km s−1 for HC(O)NH2, 0.877 Jy beam−1 km s−1for CH3NCO, 1.082 Jy beam−1 km s−1 for HNCO at219.656 GHz, and 1.396 Jy beam−1 km s−1 for HNCO at 220.585 GHz. The black dashed circle indicates in all the panels the area in which the spectrum analysed in this work was extracted, which matches the GUAPOS beam of 1.′′ 2 centered at the 3mm continuum peak. The frequency and Eup energies of the transitions are shown in blue above each panel, and in red in the top-right corner of each panel, respectively.The synthesised beam is represented by the grey ellipse in the lower left corner. The black squares indicates the position of the continuum sources A, B, C, and D resolved with 7 mm VLA observations by Beltrán et al. (2021).
Current usage metrics show cumulative count of Article Views (full-text article views including HTML views, PDF and ePub downloads, according to the available data) and Abstracts Views on Vision4Press platform.
Data correspond to usage on the plateform after 2015. The current usage metrics is available 48-96 hours after online publication and is updated daily on week days.
Initial download of the metrics may take a while.