Free Access
Fig. 12
Download original image
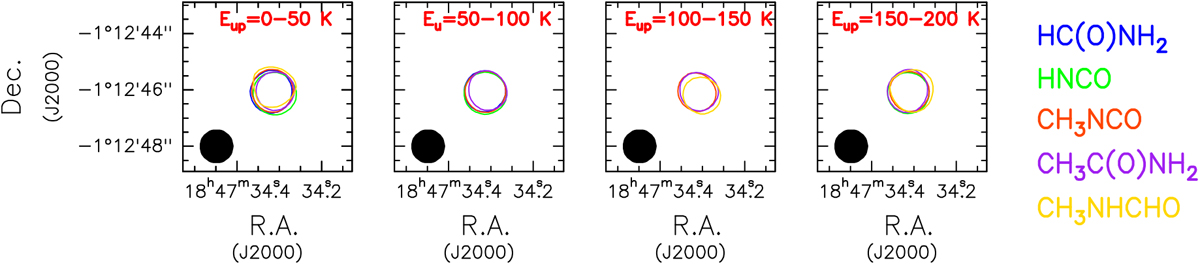
Maps of the integrated emission for the molecules studied in this paper. Different colours within the same panel represent different molecules. The contours represents 0.5 times the integrated emission peak level of the corresponding map. The beam is indicated in the left-bottom corner of the maps.
Current usage metrics show cumulative count of Article Views (full-text article views including HTML views, PDF and ePub downloads, according to the available data) and Abstracts Views on Vision4Press platform.
Data correspond to usage on the plateform after 2015. The current usage metrics is available 48-96 hours after online publication and is updated daily on week days.
Initial download of the metrics may take a while.