Fig. 10
Download original image
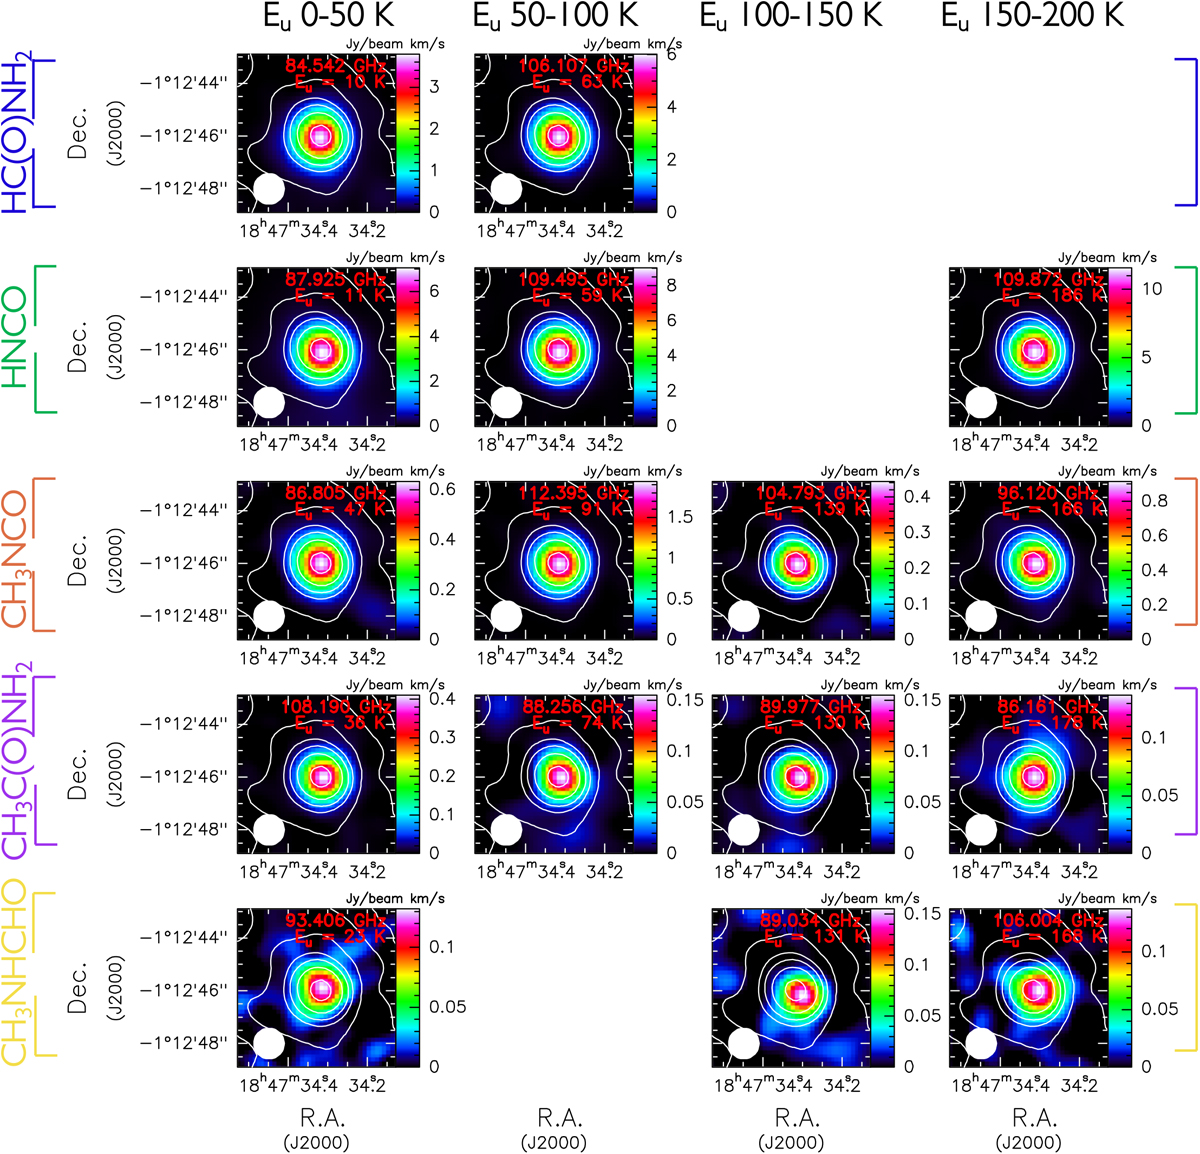
ALMA 1.′′2 resolution integrated emission maps at 3 mm of transitions with different Eup (from 0 up to 200 K, different columns) of HC(O)NH2, HNCO, CH3NCO, CH3C(O)NH2, and CH3NHCHO (different rows) obtained with the GUAPOS survey. In each panel, the white contours show the continuum emission levels at 5, 10, 20, 40, 60, 100, and 200 times the rms value of 0.8 mJy beam−1. The white ellipse in the lower left corner represents the synthesised beam.
Current usage metrics show cumulative count of Article Views (full-text article views including HTML views, PDF and ePub downloads, according to the available data) and Abstracts Views on Vision4Press platform.
Data correspond to usage on the plateform after 2015. The current usage metrics is available 48-96 hours after online publication and is updated daily on week days.
Initial download of the metrics may take a while.