Fig. B.3
Download original image
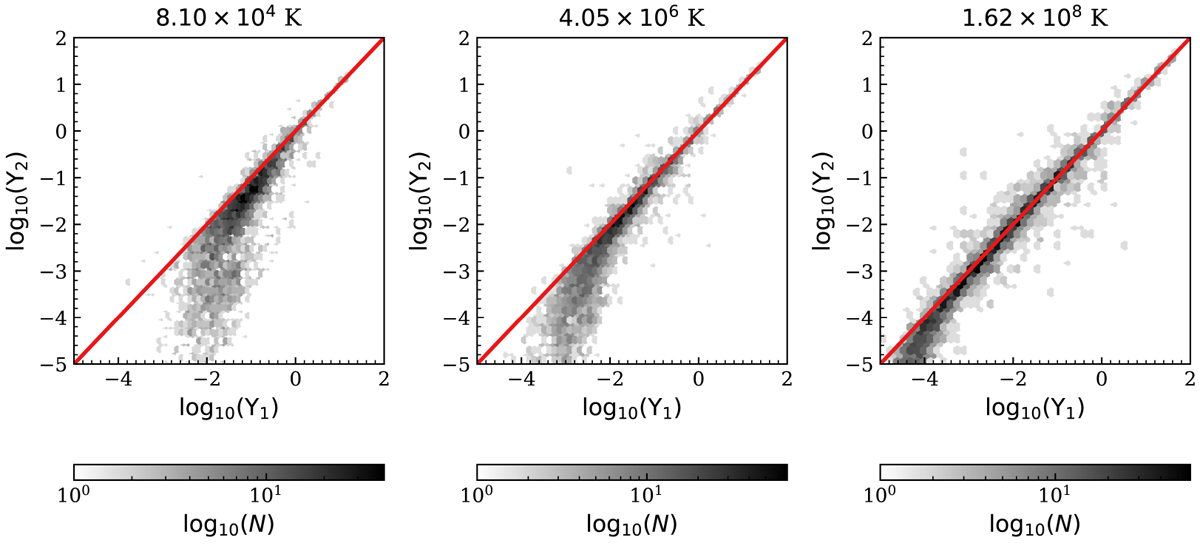
Hexbin plots of the comparison of the S IX (or S8+) effective collision strengths between our work (ϒ1) and Liang et al. (2011, ϒ2) at T = 8.10 × 10⁴ K (left) and 4.05 × 10⁶ K (middle), and ~ 1.62 × 10⁸ K (right). The darker the colour, the greater the number of transitions log10(N). The diagonal line in red indicates ϒ1 = ϒ2.
Current usage metrics show cumulative count of Article Views (full-text article views including HTML views, PDF and ePub downloads, according to the available data) and Abstracts Views on Vision4Press platform.
Data correspond to usage on the plateform after 2015. The current usage metrics is available 48-96 hours after online publication and is updated daily on week days.
Initial download of the metrics may take a while.