Free Access
Fig. 4
Download original image
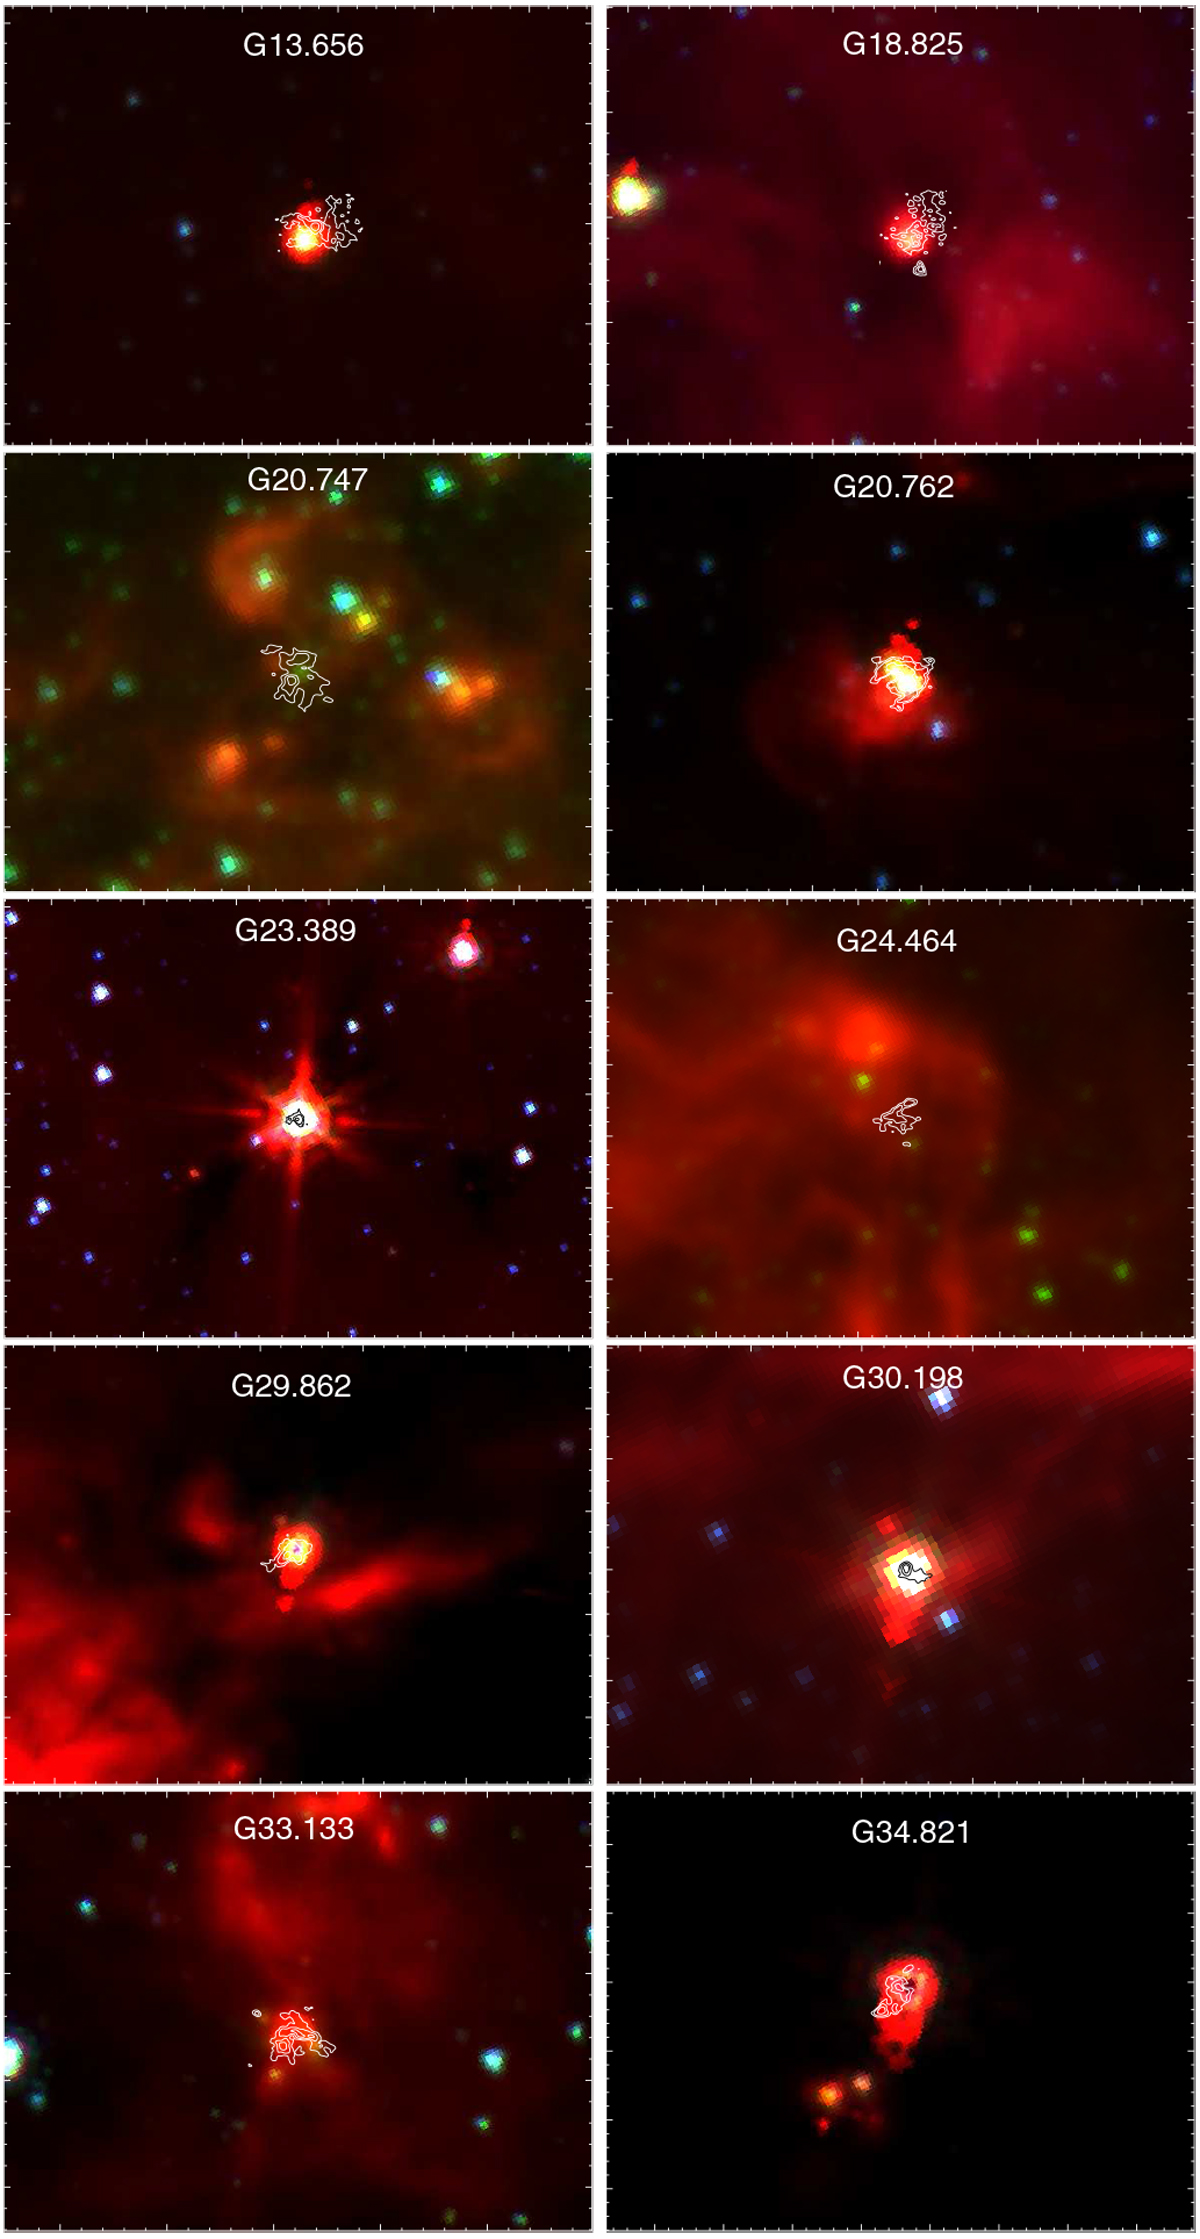
Three-colour image presenting the IR emission at 8 (red), 4.5 (green), and 3.6 μm (blue) obtained from Spitzer-IRAC. The contours represent the averaged CN emission as presented in Fig. 3. The fields of view are about 1.5 arcmin for all cases except for G23.389 which is about 3 arcmin.
Current usage metrics show cumulative count of Article Views (full-text article views including HTML views, PDF and ePub downloads, according to the available data) and Abstracts Views on Vision4Press platform.
Data correspond to usage on the plateform after 2015. The current usage metrics is available 48-96 hours after online publication and is updated daily on week days.
Initial download of the metrics may take a while.