Fig. 1
Download original image
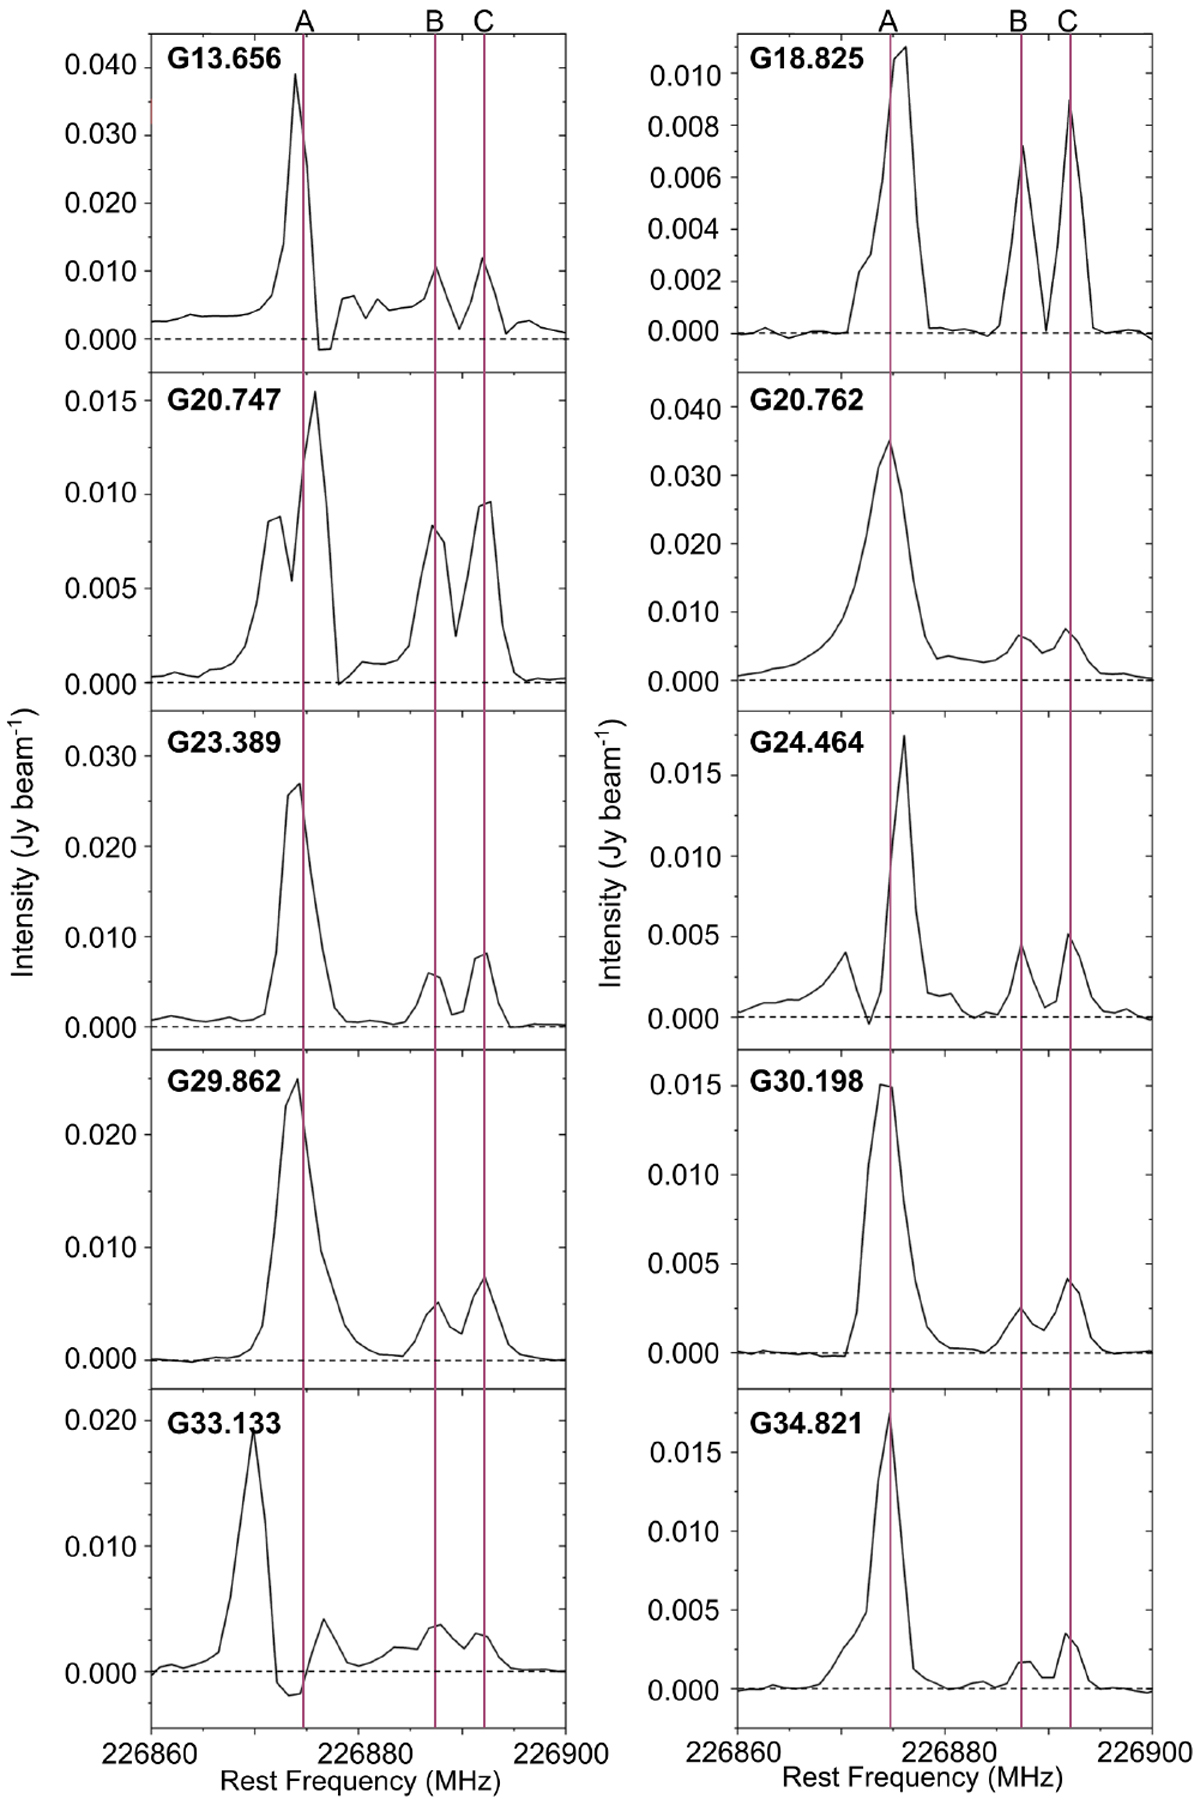
Average spectra obtained from regions of about 5′′ in radius towards each source with the aim of identifying CN lines. The spectra are presented in rest frequency. We only show the frequency range in which transitions of CN appear. The vertical lines indicate such transitions: N = 2–1 J = 5/2–3/2 F = 7/2–5/2 (A), N = 2–1 J = 5/2–3/2, F = 3/2–3/2 and F = 1/2–1/2, (B) and (C), respectively.
Current usage metrics show cumulative count of Article Views (full-text article views including HTML views, PDF and ePub downloads, according to the available data) and Abstracts Views on Vision4Press platform.
Data correspond to usage on the plateform after 2015. The current usage metrics is available 48-96 hours after online publication and is updated daily on week days.
Initial download of the metrics may take a while.