Fig. 7.
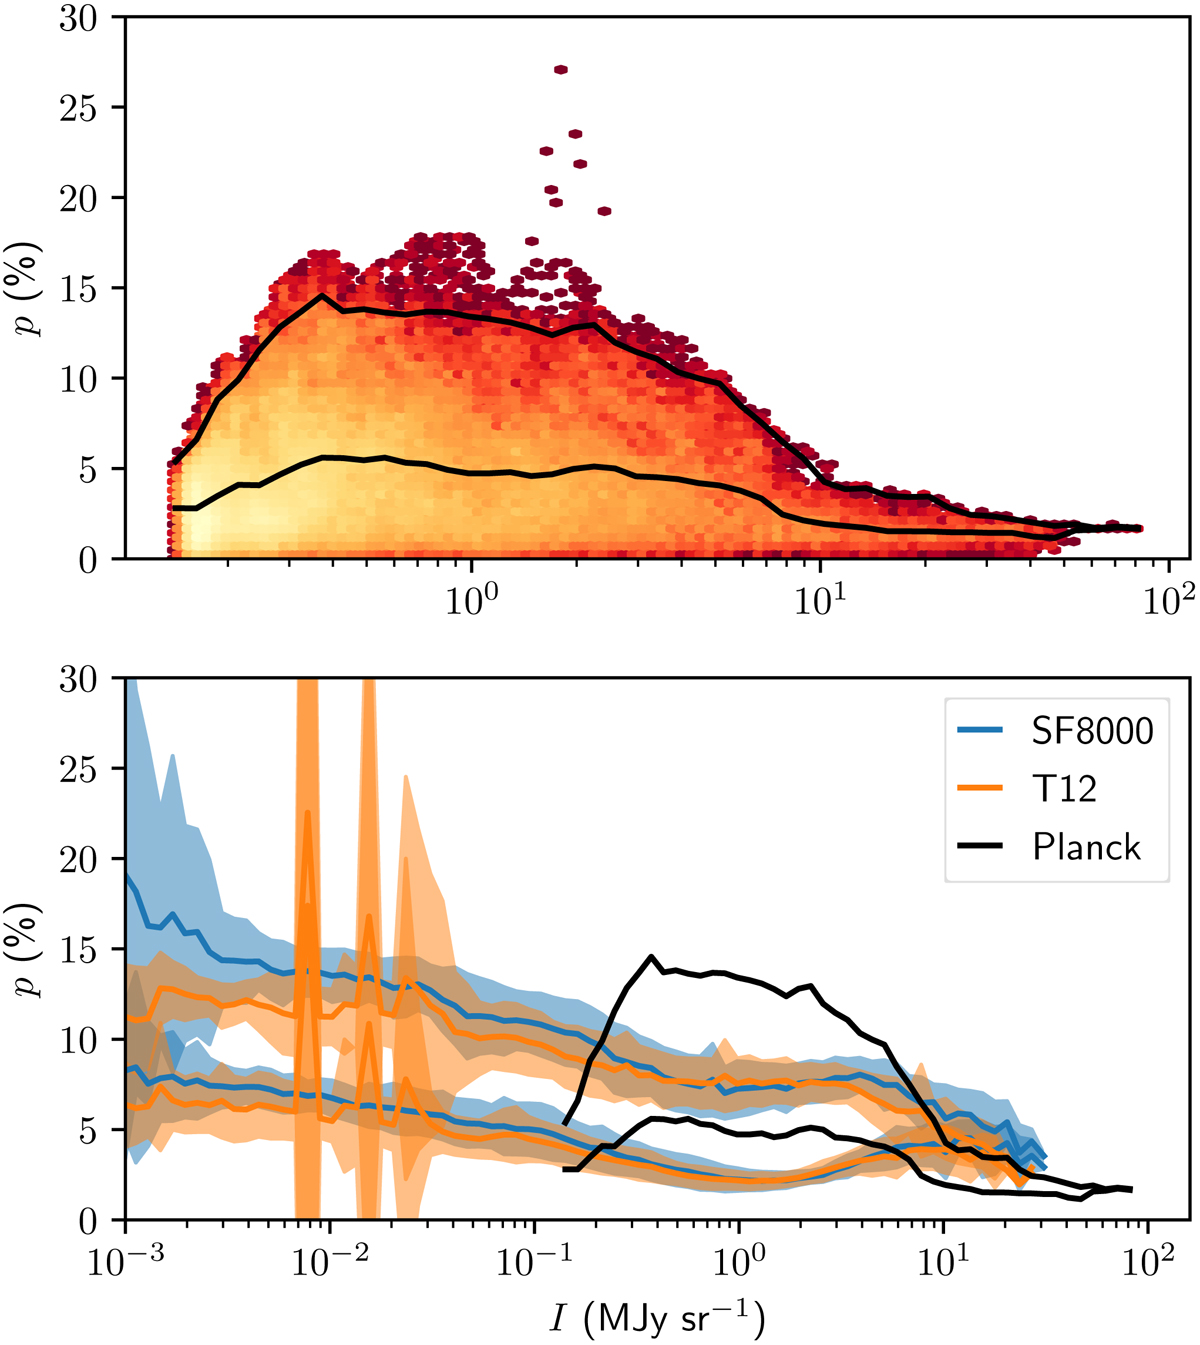
Download original image
Linear polarisation fraction as a function of total intensity. Top: Planck results for the full sky. Pixels have been binned to visualise the pixel density, with yellow indicating more pixels on a logarithmic scale. The black lines indicate the mean value for p and the value for the 99% percentile of p within 50 logarithmic bins in I. Bottom: results from the six level 3 Auriga halos, again showing the mean and 99% percentile value of p within 100 logarithmic bins in I. The solid lines indicate the average values of the mean and 99% percentile across all six halos and all four observer positions, while the shaded regions indicate the standard deviation across the six halos and four positions. The black lines are the same as in the top panel.
Current usage metrics show cumulative count of Article Views (full-text article views including HTML views, PDF and ePub downloads, according to the available data) and Abstracts Views on Vision4Press platform.
Data correspond to usage on the plateform after 2015. The current usage metrics is available 48-96 hours after online publication and is updated daily on week days.
Initial download of the metrics may take a while.