Fig. 6.
Download original image
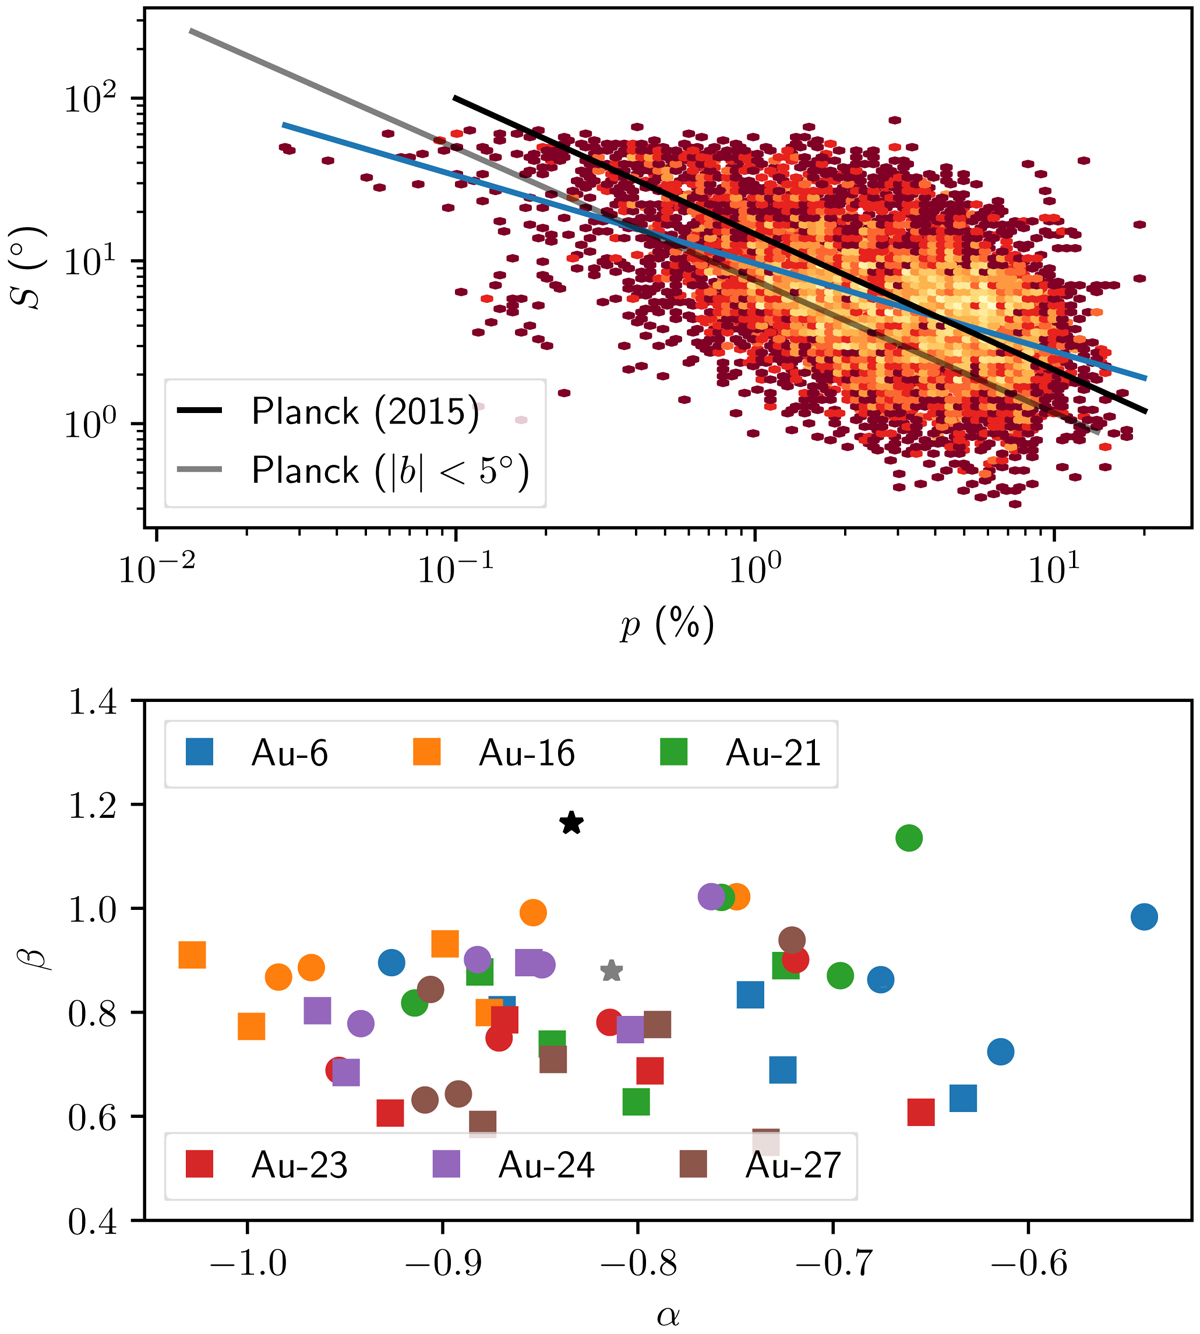
Top: angular dispersion function as a function of linear polarisation fraction for all pixels with |b| < 5° in the Auriga 6 model with dust allocation recipe recSF8000 and an observer at the low density position in the outer annulus. Pixels have been binned to visualise the pixel density, with yellow indicating more pixels on a logarithmic scale. The blue line is a linear fit to the pixel values of the form log10(S/°) = αlog10(p/%)+β. The black line correspond to the Planck Collaboration XIX (2015) fit, while the grey line is a fit to the Planck data from Planck Collaboration XII (2020). Bottom: fit coefficients α and β for the linear fits shown in the top panel, but now for all level 3 Auriga halos, as indicated in the legend. Discs indicate models that use dust allocation recipe recSF8000, while squares correspond to dust allocation recipe recT12. The stars correspond to the Planck data fits, with the same colours as in the top panel.
Current usage metrics show cumulative count of Article Views (full-text article views including HTML views, PDF and ePub downloads, according to the available data) and Abstracts Views on Vision4Press platform.
Data correspond to usage on the plateform after 2015. The current usage metrics is available 48-96 hours after online publication and is updated daily on week days.
Initial download of the metrics may take a while.