Fig. 4.
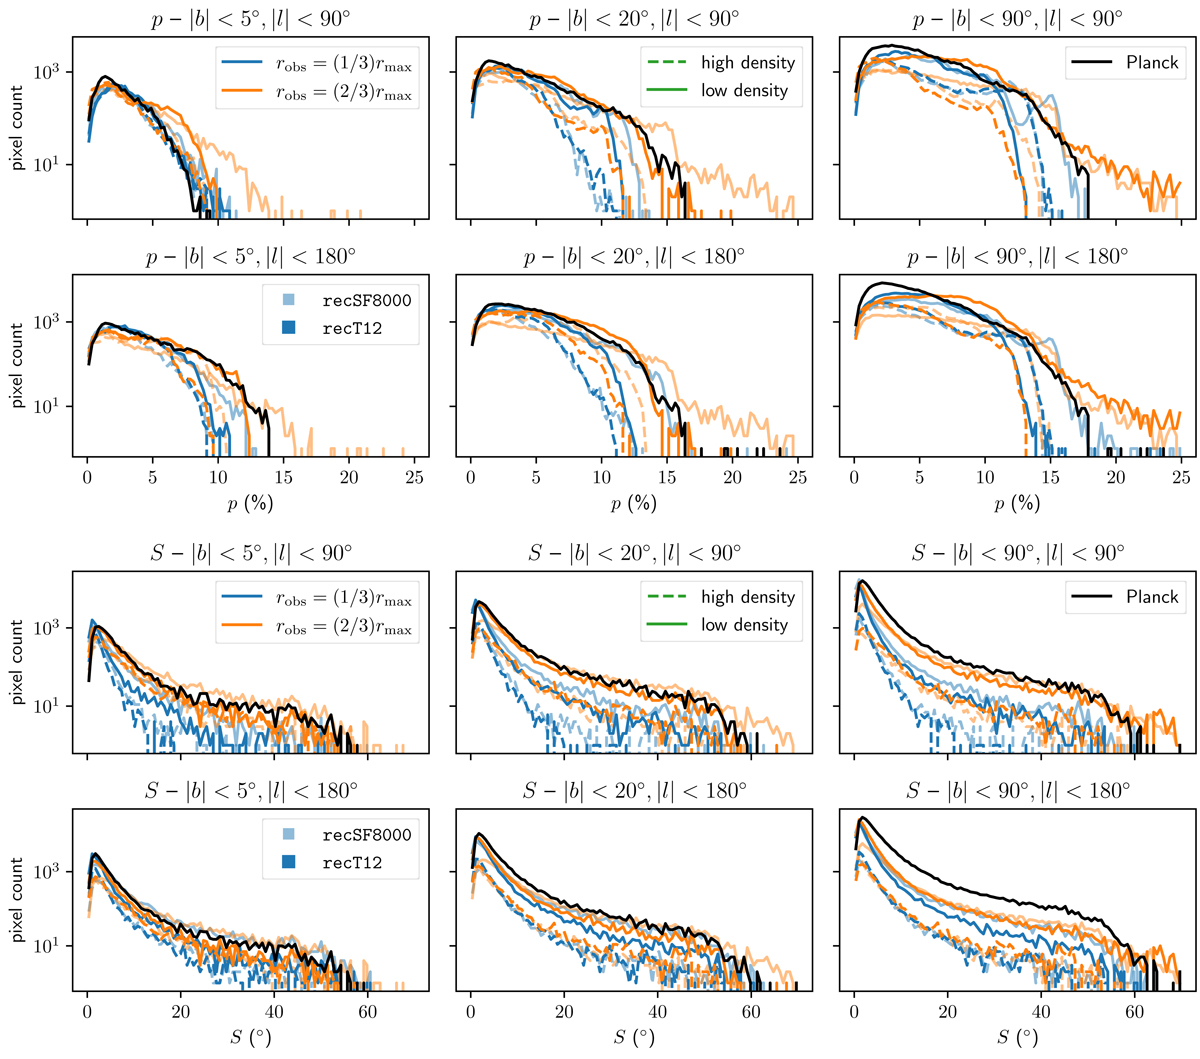
Download original image
Histograms of the linear polarisation fraction (top rows) and polarisation angle dispersion function (bottom rows) for six different cuts in galactic coordinates, as indicated above each panel. These histograms were computed for the masked images shown in Figs. 2 and 3 that use our reference dust model with alignment fraction fS, A = 0.6. The different colours correspond to different observer positions (columns in Figs. 2–3), while the different line styles correspond to the different observer densities (rows in Figs. 2–3). The opacity of the lines is determined by the dust allocation recipe, as indicated in the legend. The black solid line corresponds to histograms computed from the publicly available Planck HFI 353 GHz map, as presented in Planck Collaboration XII (2020), using the same cuts in galactic coordinates. All histograms show the actual pixel count; no normalisation is performed.
Current usage metrics show cumulative count of Article Views (full-text article views including HTML views, PDF and ePub downloads, according to the available data) and Abstracts Views on Vision4Press platform.
Data correspond to usage on the plateform after 2015. The current usage metrics is available 48-96 hours after online publication and is updated daily on week days.
Initial download of the metrics may take a while.