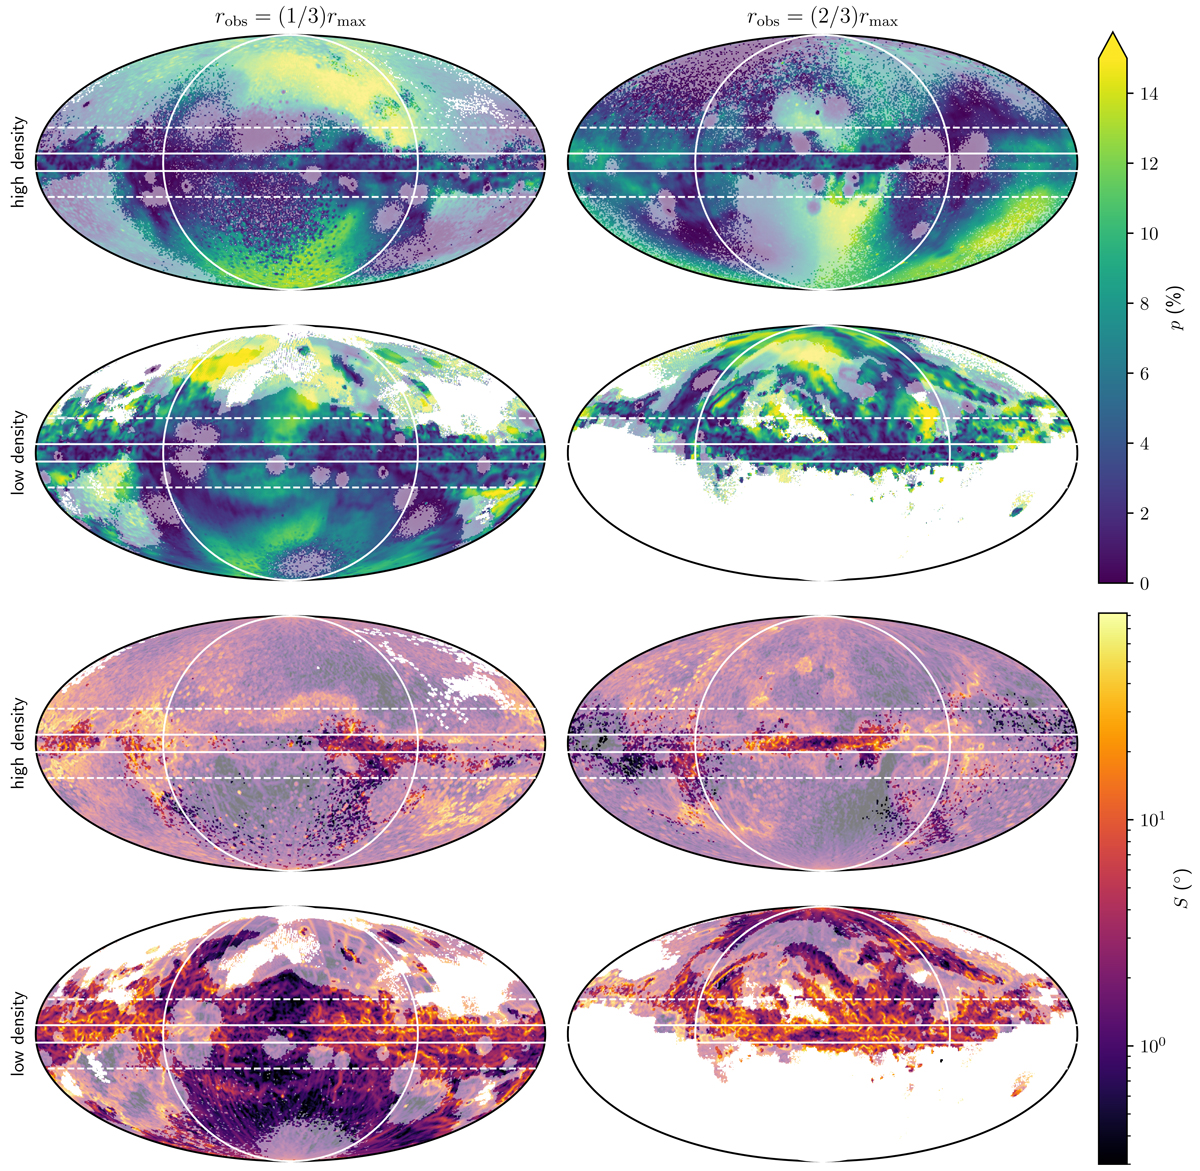
Fig. 2.
Download original image
Synthetic linear polarisation fraction (top rows) and polarisation angle dispersion function (bottom rows) across the entire sky for four observer positions within the galactic disc of the Auriga 6 model. The model shown here assumes a silicate-only dust mix with fS, A = 0.6 and a maximum intrinsic linear polarisation fraction of ≈15%. Dust was allocated using recipe recSF8000. The observer position is chosen within a ring with the radius indicated in the header of each column, and is chosen either as the position of the cell with the lowest or the highest density, as indicated in the label for each row. For our analysis, we have masked out the parts of the sky that have not recorded sufficient Monte Carlo photon packets to be statistically significant. Parts of the sky that are affected by this masking have been shaded out. The non-shaded parts of the map were computed after masking and hence do not necessarily match the shaded map at the boundary. The maps have the centre of the Auriga galaxy at their centre, and further have the galactic longitude l increasing from right to left in the horizontal direction. The galactic latitude b increases from bottom to top in the vertical direction. The white lines indicate the limits at l = ±90° and b = ±5° , ±20° used when comparing different sky portions. We note that high values in the top panels have been saturated to a maximum intrinsic linear polarisation fraction of 15%, as indicated by the triangle in the colour bar.
Current usage metrics show cumulative count of Article Views (full-text article views including HTML views, PDF and ePub downloads, according to the available data) and Abstracts Views on Vision4Press platform.
Data correspond to usage on the plateform after 2015. The current usage metrics is available 48-96 hours after online publication and is updated daily on week days.
Initial download of the metrics may take a while.