Fig. 16.
Download original image
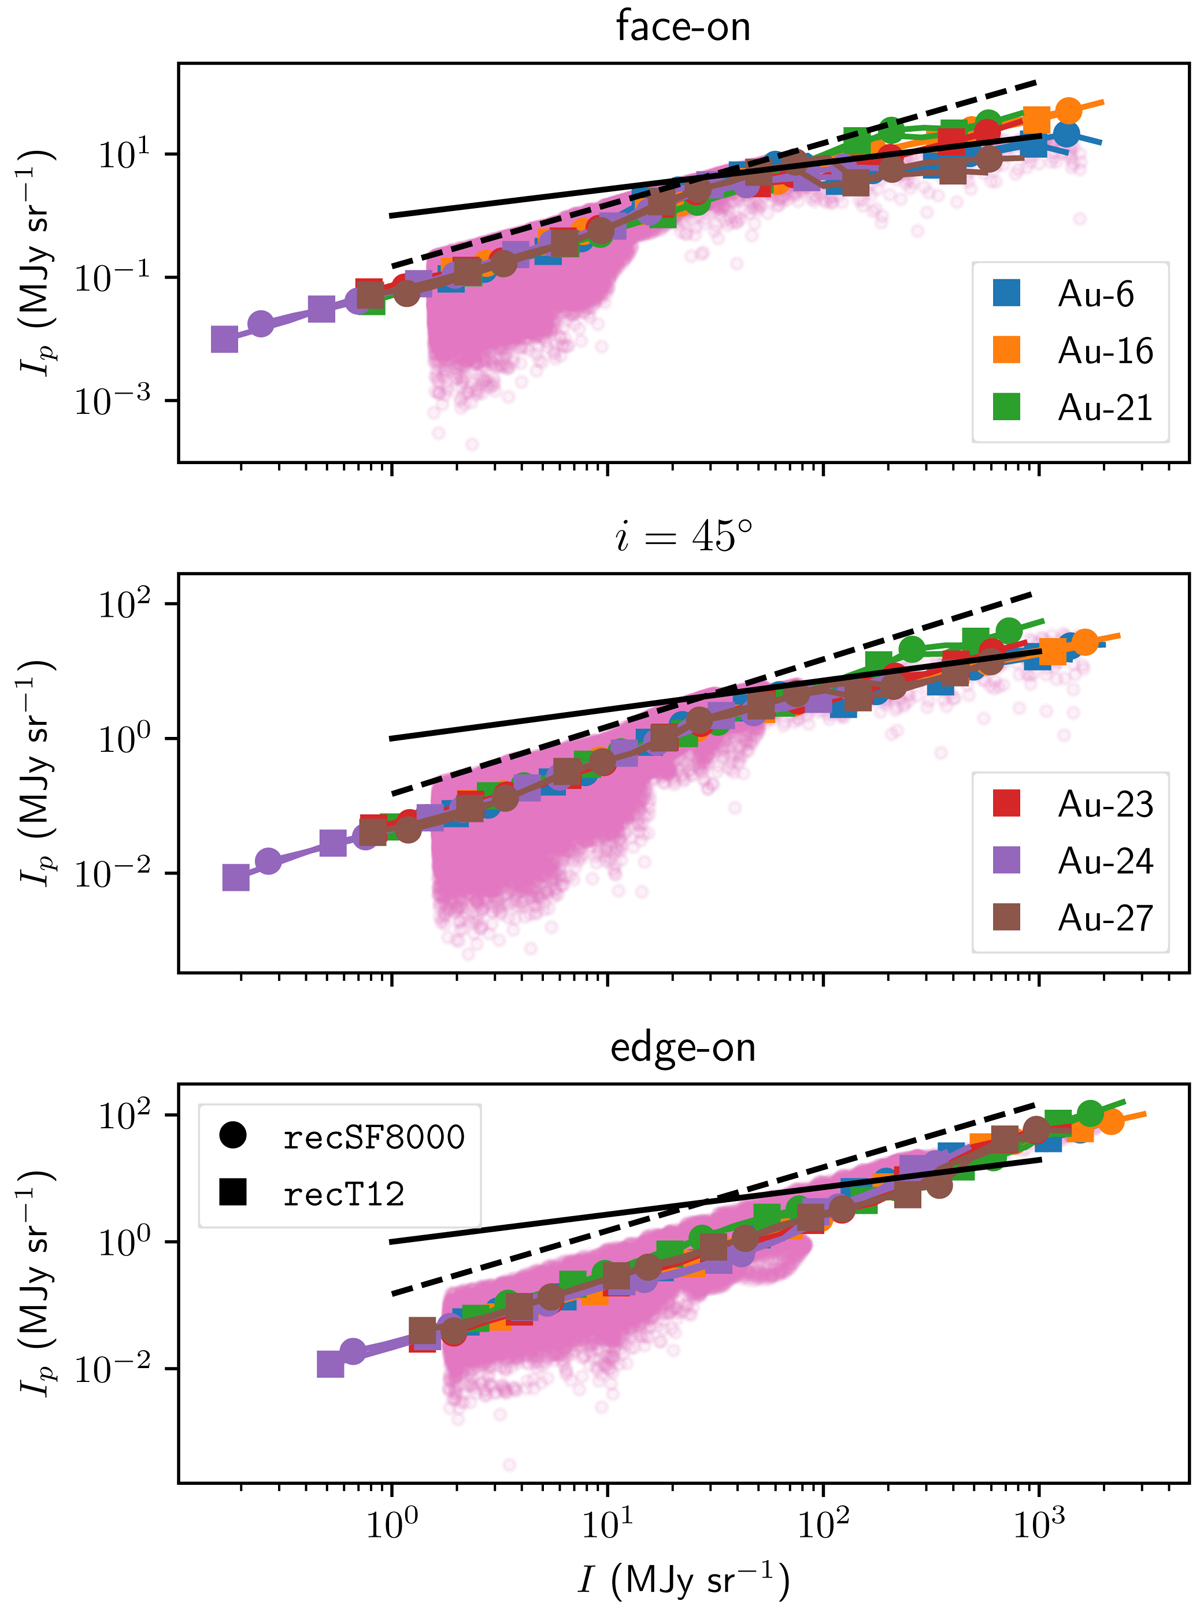
Polarised intensity as a function of total intensity for a face-on (top), i = 45° (middle) and edge-on (bottom) inclination, for all six level 3 Auriga galaxies using the two different dust allocation recipes, as observed in the synthetic HAWC+ D broad band. The transparent pink dots show individual pixel values for the Auriga 6 model with recipe recT12. The other coloured symbols correspond to the median polarised intensity in 20 logarithmic intensity bins, now for all models, as indicated in the legend. All curves have been limited to a minimum intensity of I = 0.001Imax. The different symbols correspond to the different dust allocation recipes. The solid black lines are the least squares fits to the M51 and NGC 891 data presented in Jones et al. (2020), which have practically the same slope. The dashed black line denotes the upper limit of the intrinsic dust model, Ip = 0.15I.
Current usage metrics show cumulative count of Article Views (full-text article views including HTML views, PDF and ePub downloads, according to the available data) and Abstracts Views on Vision4Press platform.
Data correspond to usage on the plateform after 2015. The current usage metrics is available 48-96 hours after online publication and is updated daily on week days.
Initial download of the metrics may take a while.