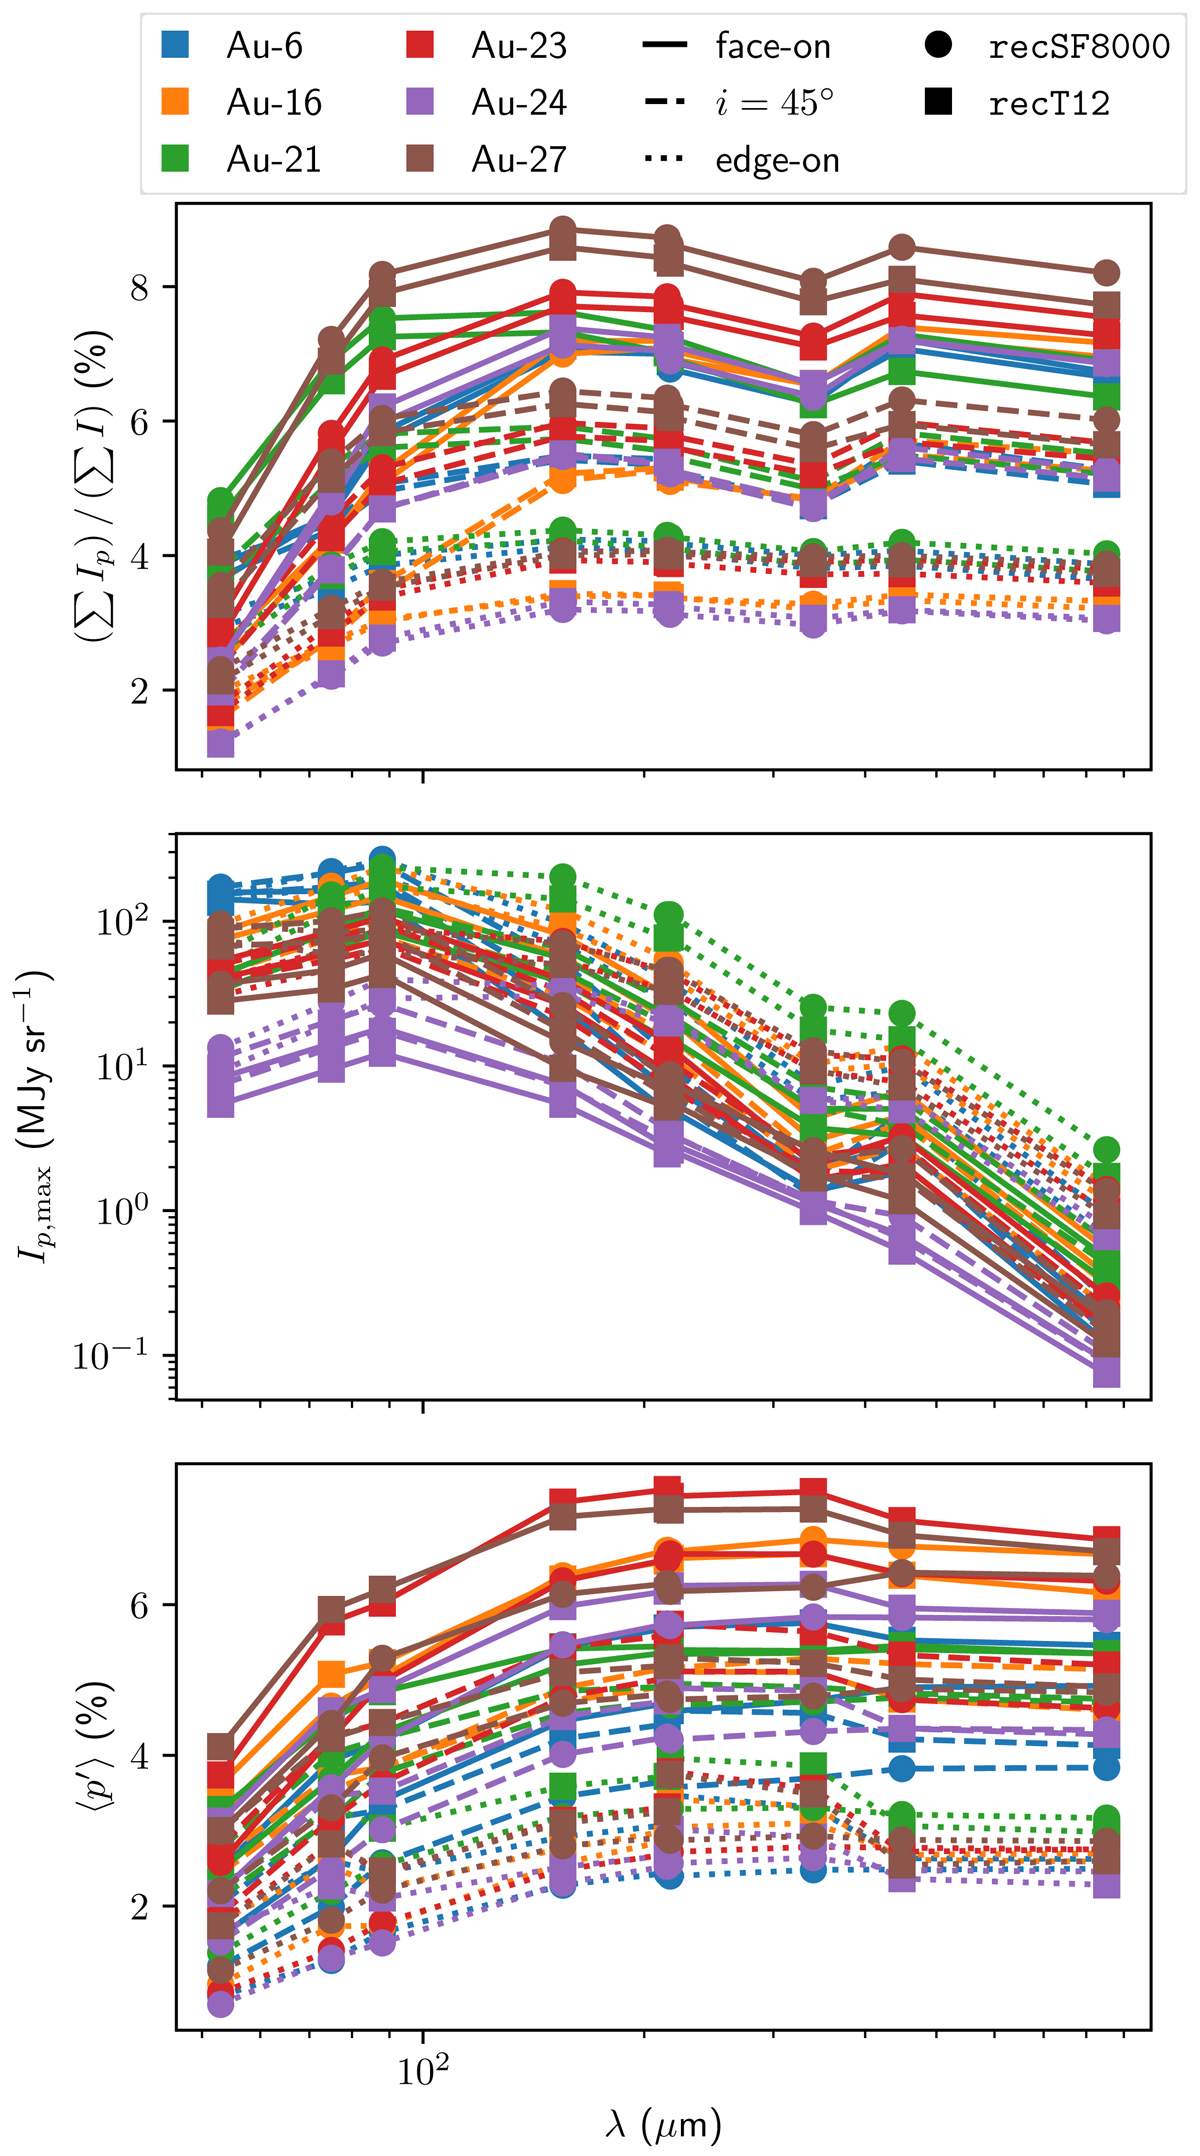
Fig. 15.

Download original image
Intensity-averaged linear polarisation fraction (top), maximum polarised intensity (middle) and uniformly smoothed average linear polarisation fraction (bottom) as a function of pivot wavelength for the nine synthetic broad bands, three different inclinations and all six level 3 Auriga galaxies in our sample. The different colours correspond to different Auriga models, while the different lines indicate different inclinations and the different symbols indicate different dust allocation recipes. All models use our reference dust model with fS, A = 0.6. We note that the HAWC+ E and B-BOP 200 broad bands have very similar pivot wavelengths and are indistinguishable in this figure.
Current usage metrics show cumulative count of Article Views (full-text article views including HTML views, PDF and ePub downloads, according to the available data) and Abstracts Views on Vision4Press platform.
Data correspond to usage on the plateform after 2015. The current usage metrics is available 48-96 hours after online publication and is updated daily on week days.
Initial download of the metrics may take a while.


