Fig. 9.
Download original image
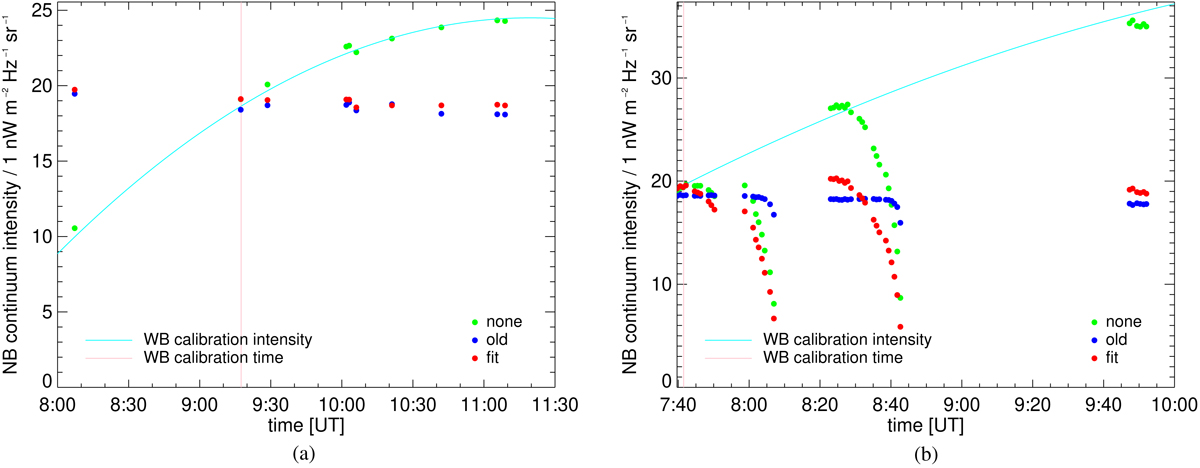
CHROMIS Ca II NB continuum (median) intensities of restored data (individual scans), with and without temporal correction as indicated in the legends. The WB calibration curves are the fit functions (shown in Fig. 8a for the 2016 September 19 data), scaled to approximately match the disk center continuum intensities. The dot colors refer to data with no correction (green), the old correction based on the WB intensity in the data set itself, and the correction based on a fit to disk center data (red). (a) Data from 2016-09-19, μ ≈ 1 (near disk center). (b) Data from 2019-06-21, varying μ.
Current usage metrics show cumulative count of Article Views (full-text article views including HTML views, PDF and ePub downloads, according to the available data) and Abstracts Views on Vision4Press platform.
Data correspond to usage on the plateform after 2015. The current usage metrics is available 48-96 hours after online publication and is updated daily on week days.
Initial download of the metrics may take a while.