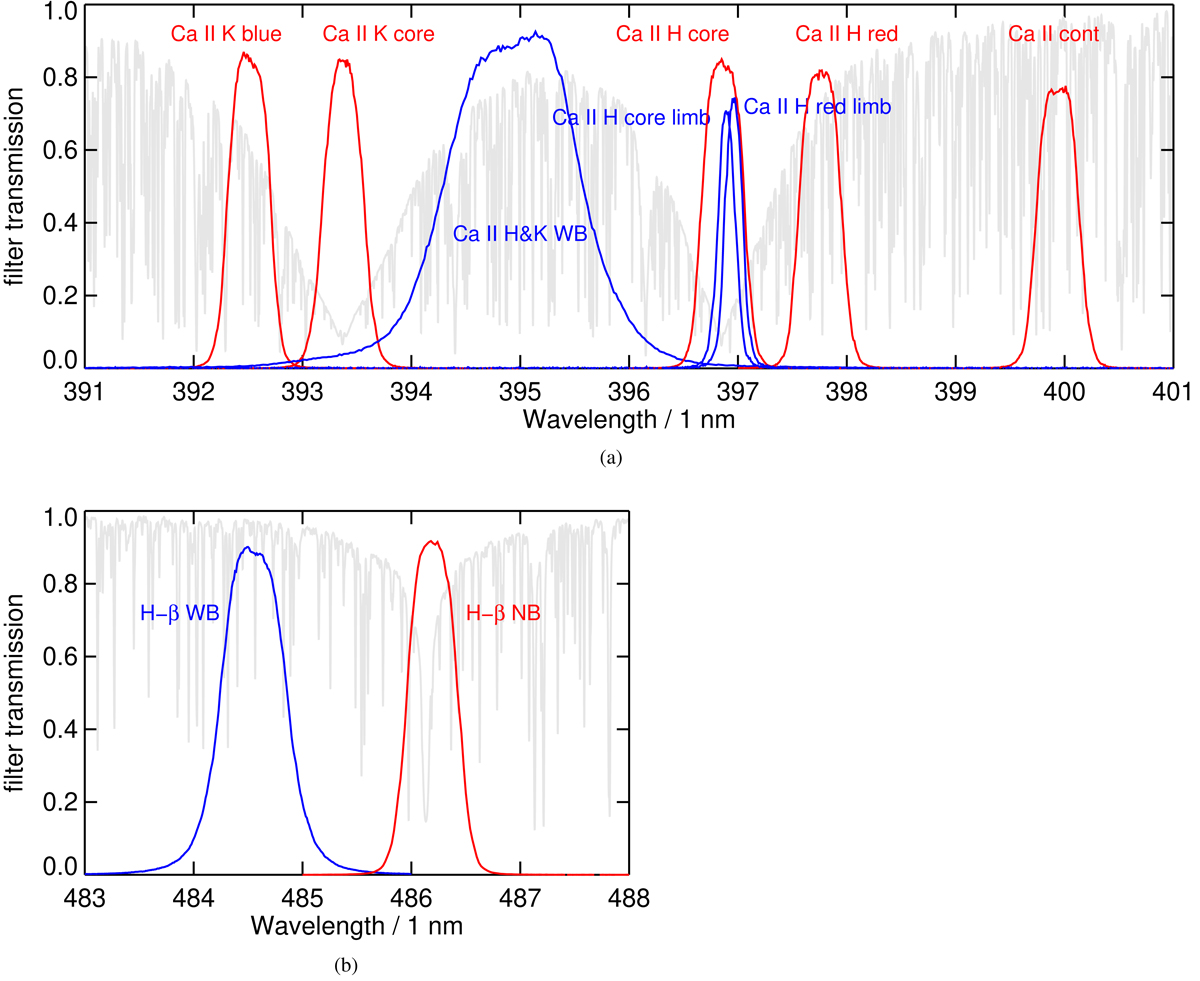
Fig. 4.
Download original image
CHROMIS filter transmission profiles (normal incidence). Red lines: NB prefilters. Blue lines: WB filters. The filter profiles shown are measured in the center of the filter by the manufacturer. The FPI profiles are not wide enough to plot them here. The gray lines represent the average disk center atlas spectrum, normalized to the continuum. See also Table 2. (a) Ca II filter profiles. (b) H-β filter profiles.
Current usage metrics show cumulative count of Article Views (full-text article views including HTML views, PDF and ePub downloads, according to the available data) and Abstracts Views on Vision4Press platform.
Data correspond to usage on the plateform after 2015. The current usage metrics is available 48-96 hours after online publication and is updated daily on week days.
Initial download of the metrics may take a while.