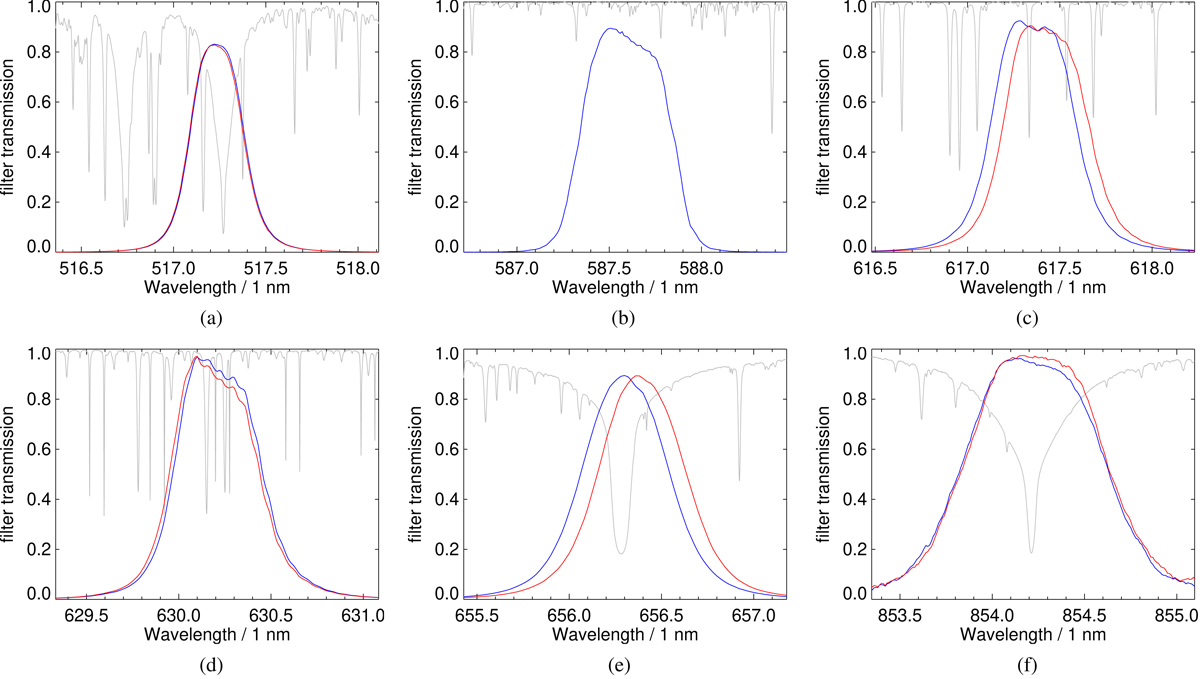
Fig. 3.
Download original image
CRISP prefilter transmission profiles as measured by the manufacturer for the filters installed before the 2018 season. The blue curves correspond to the smaller part number and (for the wavelength bands where we have spares) red curves the larger. The gray lines represent the average disk center atlas spectrum, normalized to the continuum. See also Table 1. (a) 517.2 nm filter profiles. (b) 587.6 nm filter profile. (c) 617.4 nm filter profiles. (d) 630.2 nm filter profiles. (e) 656.3 nm filter profiles. (f) 854.3 nm filter profiles.
Current usage metrics show cumulative count of Article Views (full-text article views including HTML views, PDF and ePub downloads, according to the available data) and Abstracts Views on Vision4Press platform.
Data correspond to usage on the plateform after 2015. The current usage metrics is available 48-96 hours after online publication and is updated daily on week days.
Initial download of the metrics may take a while.