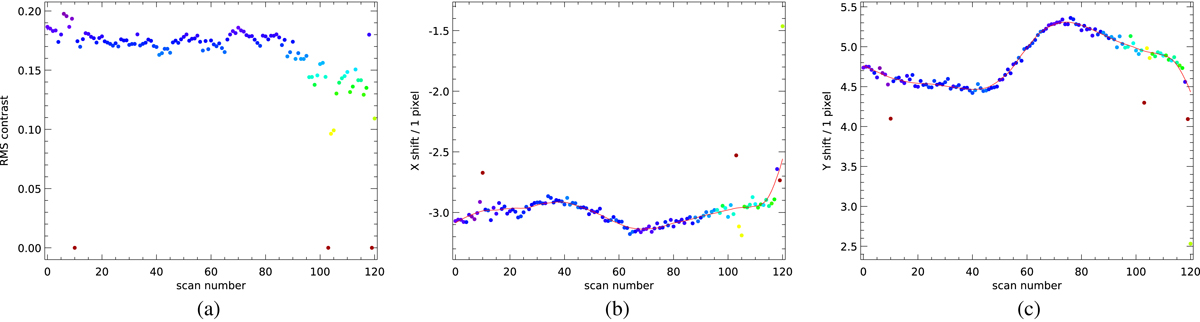
Fig. 12.
Download original image
Continuum alignment diagnostic plots for 121 Ca II scans collected from 09:28:36 on 2016 June 19, covering approximately one period of the undulations shown in Fig. 11. (a) WB RMS contrast. (b) Continuum/WB X misalignment. (c) Continuum/WB Y misalignment. Filled circles in (b) and (c): Misalignment measured by use of cross-correlation with MOMFBD restored data, colors represent RMS contrast as shown in (a). Lines in (b) and (c): Shifts in X and Y used for alignment, misalignment smoothed with a heuristic algorithm that gives more weight to the high-contrast data points. Diagnostic plots like these are automatically produced by SSTRED to allow the user to verify how well the contrast-aware smoothing worked.
Current usage metrics show cumulative count of Article Views (full-text article views including HTML views, PDF and ePub downloads, according to the available data) and Abstracts Views on Vision4Press platform.
Data correspond to usage on the plateform after 2015. The current usage metrics is available 48-96 hours after online publication and is updated daily on week days.
Initial download of the metrics may take a while.