Fig. 11.
Download original image
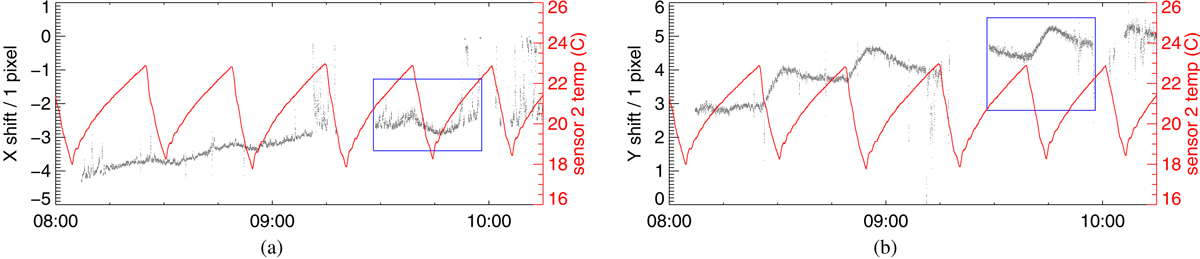
Covariation of the misalignment in continuum and WB measured with raw data and telescope bottom plate temperature. These data were collected during the morning hours of 2016 June 19. In bad seeing, measurements most often tend toward zero. The blue boxes correspond approximately to the plot ranges of Figs. 12b and c. (a) X misalignment. (b) Y misalignment.
Current usage metrics show cumulative count of Article Views (full-text article views including HTML views, PDF and ePub downloads, according to the available data) and Abstracts Views on Vision4Press platform.
Data correspond to usage on the plateform after 2015. The current usage metrics is available 48-96 hours after online publication and is updated daily on week days.
Initial download of the metrics may take a while.