Fig. 9.
Download original image
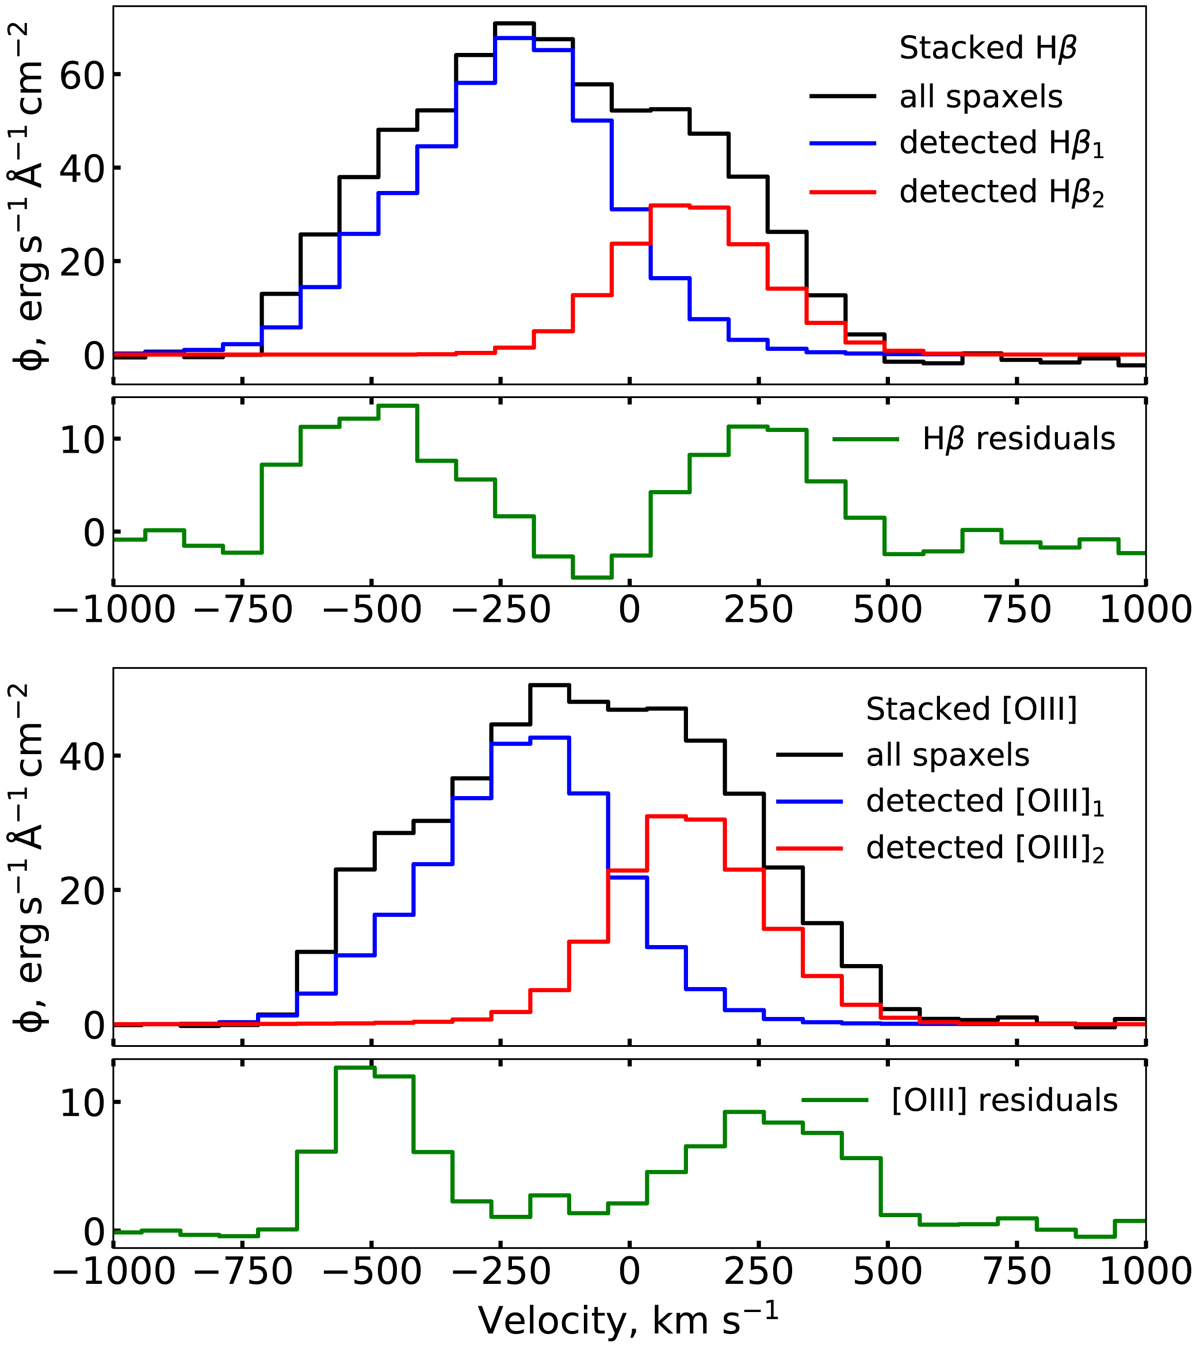
Stacked ionised-gas lines. Top and bottom panels: stacked Hβ and [OIII]λ5008 emission lines, respectively, from all MaNGA spaxels in black. We show with blue and red the stacked blueshifted and redshifted components of our fitted model, only including spaxels with detected lines. Below the stacked emission lines, we show the residuals that exhibit excesses at large velocities.
Current usage metrics show cumulative count of Article Views (full-text article views including HTML views, PDF and ePub downloads, according to the available data) and Abstracts Views on Vision4Press platform.
Data correspond to usage on the plateform after 2015. The current usage metrics is available 48-96 hours after online publication and is updated daily on week days.
Initial download of the metrics may take a while.