Fig. 8.
Download original image
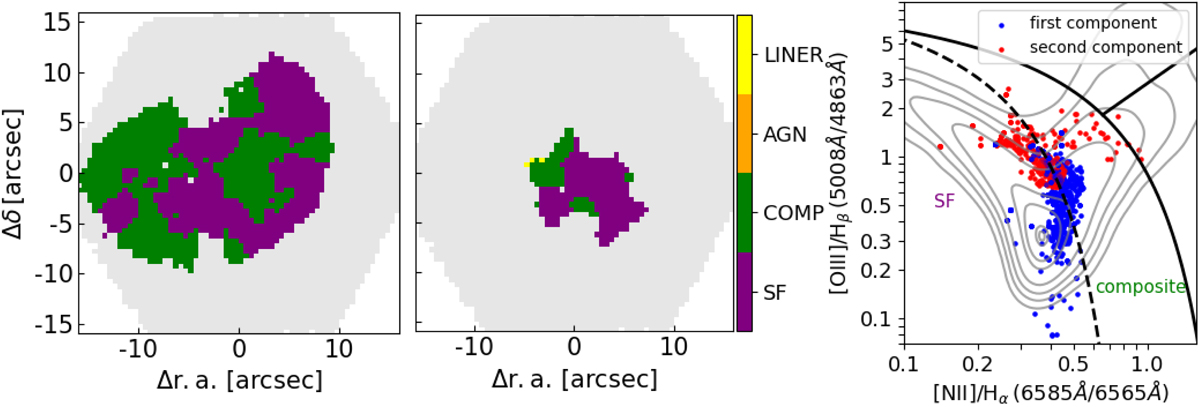
Ionisation properties of the gas for the two components of J221024.49+114247.0. Left and middle panels: BPT (Baldwin et al. 1981) maps for both fitted components. Right panel: BPT diagram showing the position of the spaxels. The S/N threshold is set at 3. The spaxels where the S/N of at least one emission line is below the corresponding threshold are masked. Moreover, for the redshifted component, the masks described in Sect. 2.1 are applied. The last panel displays the LINER, AGN, composite, and star-forming excitation regions as defined by Kewley et al. (2001), Kauffmann et al. (2003), and Schawinski et al. (2007). The grey contours refer to galaxies representative of the RCSED sample.
Current usage metrics show cumulative count of Article Views (full-text article views including HTML views, PDF and ePub downloads, according to the available data) and Abstracts Views on Vision4Press platform.
Data correspond to usage on the plateform after 2015. The current usage metrics is available 48-96 hours after online publication and is updated daily on week days.
Initial download of the metrics may take a while.