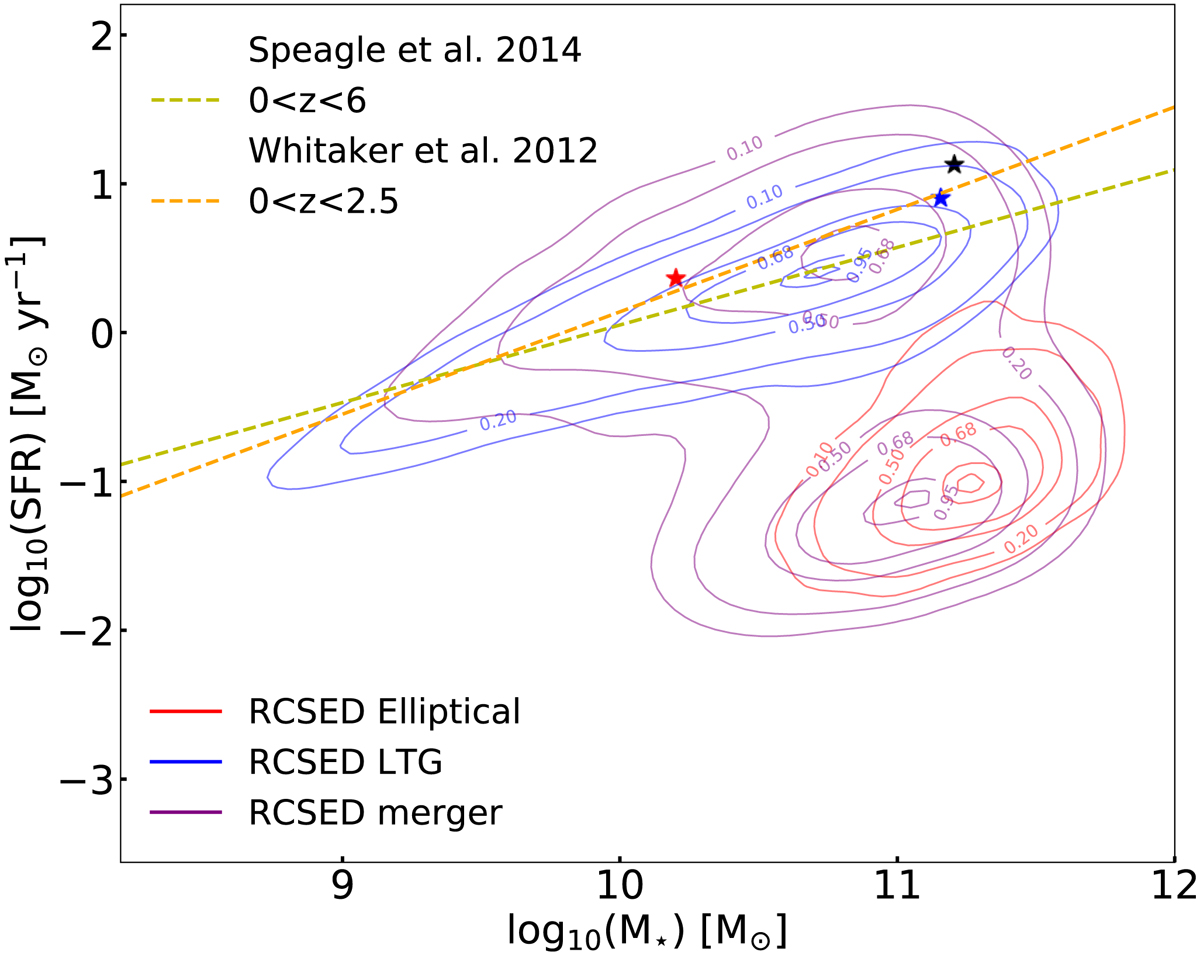
Fig. 7.
Download original image
SFR vs. stellar mass plot. The black star corresponds to the total system, relying on the values provided by Salim et al. (2016) for J221024.49+114247.0. The blue and red stars refer to the main and secondary component, respectively, based on our SFR and stellar mass computations. The contours correspond to representative galaxies of the RCSED sample (Chilingarian et al. 2017), classified using Domínguez Sánchez et al. (2018).
Current usage metrics show cumulative count of Article Views (full-text article views including HTML views, PDF and ePub downloads, according to the available data) and Abstracts Views on Vision4Press platform.
Data correspond to usage on the plateform after 2015. The current usage metrics is available 48-96 hours after online publication and is updated daily on week days.
Initial download of the metrics may take a while.