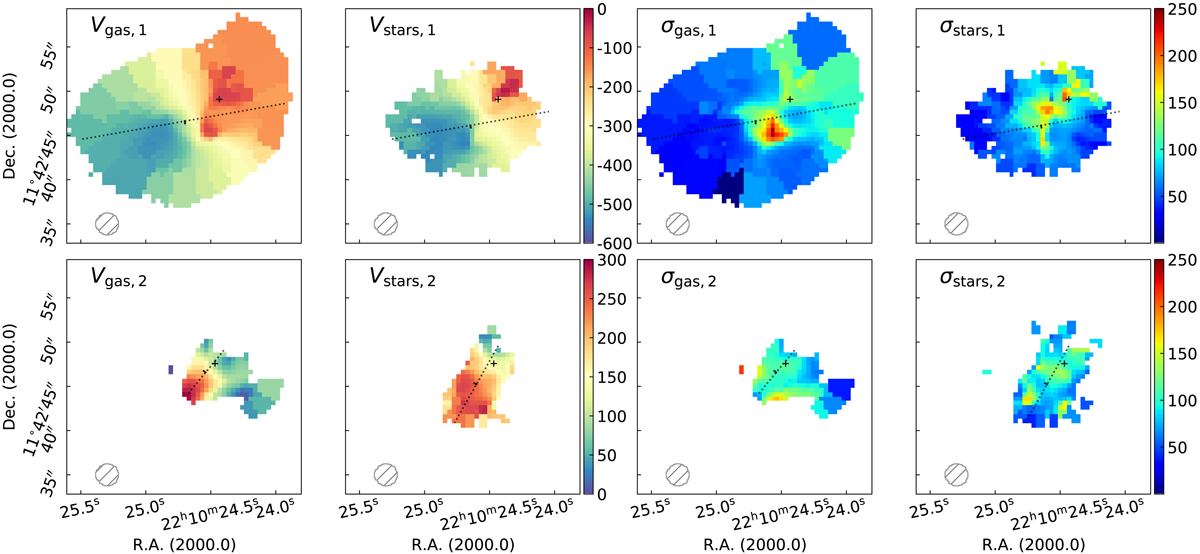
Fig. 3.
Download original image
Gas and star kinematics. First row: maps for the first component, and second row: second component detected in MaNGA data. First and second columns: respective ionised gas and stellar velocity fields (in km s−1). The dotted black lines refer to the computed position angles. Third and fourth columns: respective velocity dispersion fields (in km s−1) for the gas and the stars. As in Fig. 2, the black crosses indicate the position of the extinction-corrected Hα flux peak for the represented component.
Current usage metrics show cumulative count of Article Views (full-text article views including HTML views, PDF and ePub downloads, according to the available data) and Abstracts Views on Vision4Press platform.
Data correspond to usage on the plateform after 2015. The current usage metrics is available 48-96 hours after online publication and is updated daily on week days.
Initial download of the metrics may take a while.