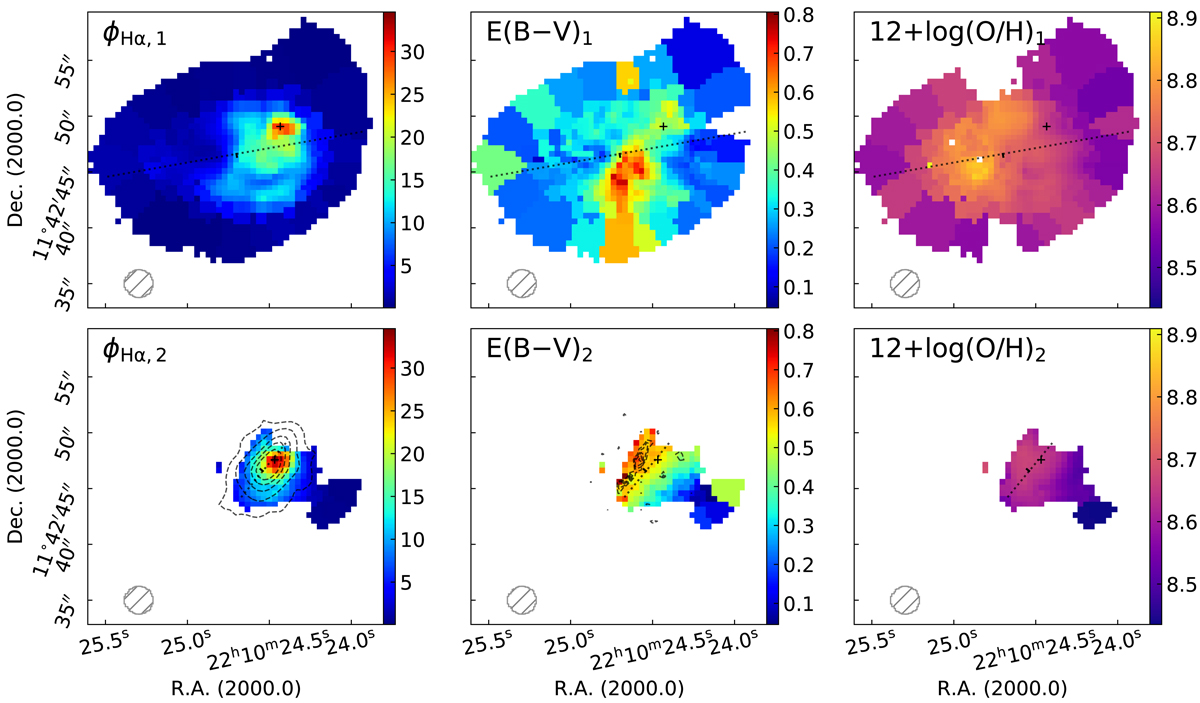
Fig. 2.
Download original image
Gas properties derived from our multi-component approach. First and second rows: maps for the first and second components detected in MaNGA data, respectively. First column: Hα extinction-corrected flux (in erg s−1 Å−1 cm−2 per spaxel), second column: extinction computed from the Balmer decrement, and last column: oxygen gas-phase abundance derived using the O3N2 calibrator. The black crosses indicate the position of the extinction-corrected Hα flux peak for the represented component. The MaNGA PSF is displayed as a hatched grey circle in the bottom-left corner of the panels.
Current usage metrics show cumulative count of Article Views (full-text article views including HTML views, PDF and ePub downloads, according to the available data) and Abstracts Views on Vision4Press platform.
Data correspond to usage on the plateform after 2015. The current usage metrics is available 48-96 hours after online publication and is updated daily on week days.
Initial download of the metrics may take a while.