Open Access
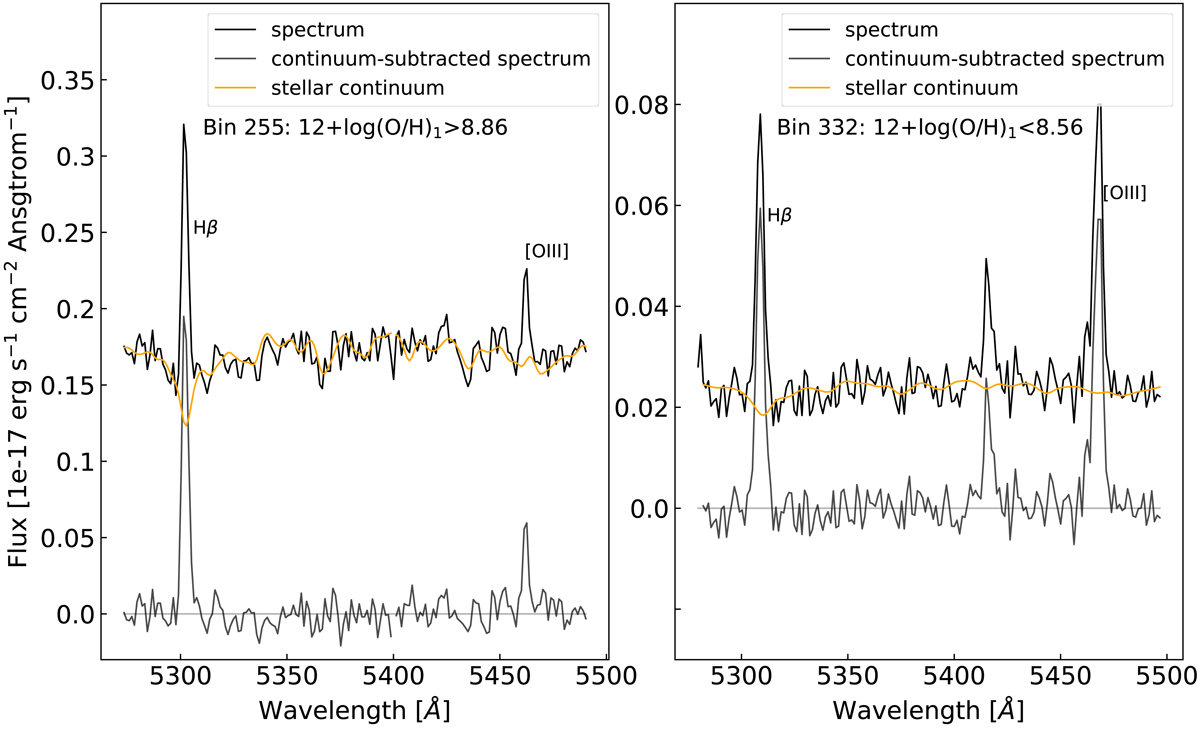
Fig. B.1.
Download original image
Different extracted spectra and their corresponding fits. Left panel: spectrum of a bin with a high gas-phase oxygen abundance, and right panel: a bin where the computed gas-phase oxygen abundance is low. Left panel: an important Balmer absorption line below Hβ can be seen.
Current usage metrics show cumulative count of Article Views (full-text article views including HTML views, PDF and ePub downloads, according to the available data) and Abstracts Views on Vision4Press platform.
Data correspond to usage on the plateform after 2015. The current usage metrics is available 48-96 hours after online publication and is updated daily on week days.
Initial download of the metrics may take a while.