Open Access
Fig. 1.
Download original image
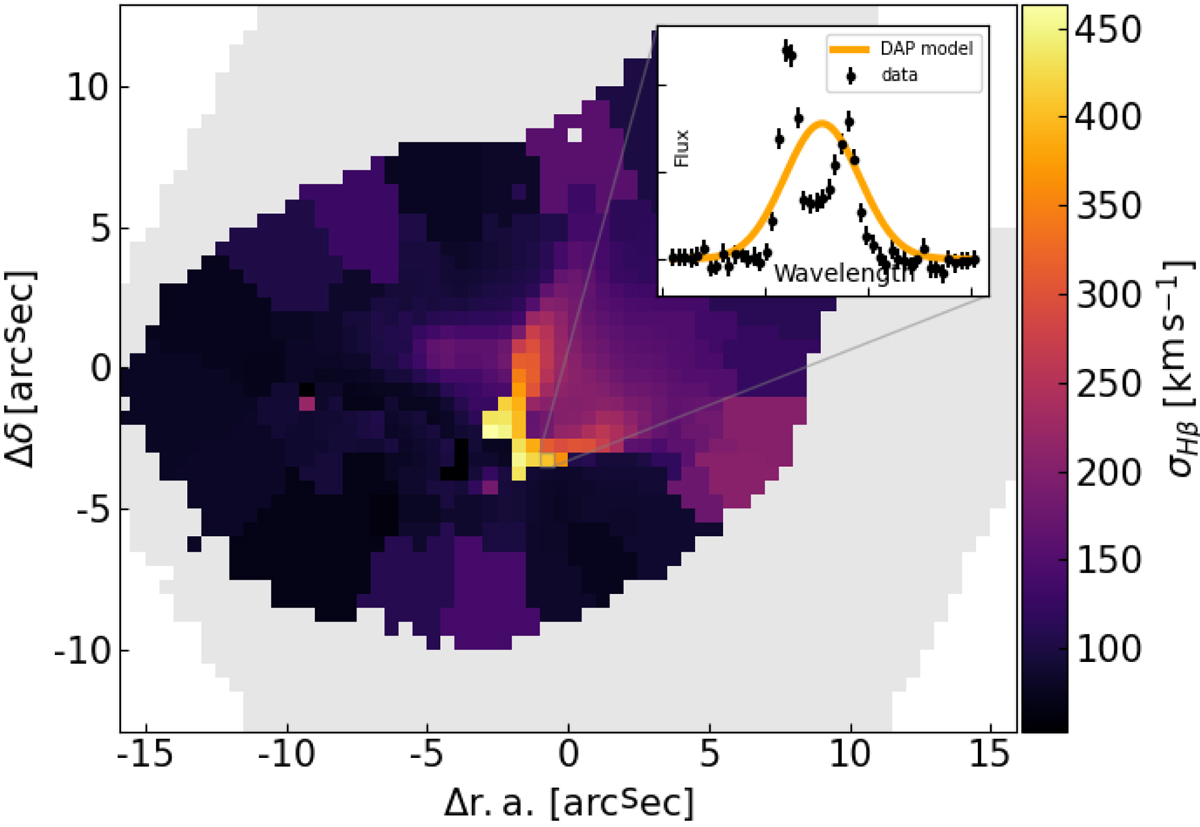
Velocity dispersion of the Hβ emission line derived by the MaNGA DAP. The MaNGA field of view is represented as a grey footprint. The included panel shows a portion of the continuum-subtracted spectrum from one spaxel where the model (in orange) does not manage to fit the spectral features.
Current usage metrics show cumulative count of Article Views (full-text article views including HTML views, PDF and ePub downloads, according to the available data) and Abstracts Views on Vision4Press platform.
Data correspond to usage on the plateform after 2015. The current usage metrics is available 48-96 hours after online publication and is updated daily on week days.
Initial download of the metrics may take a while.