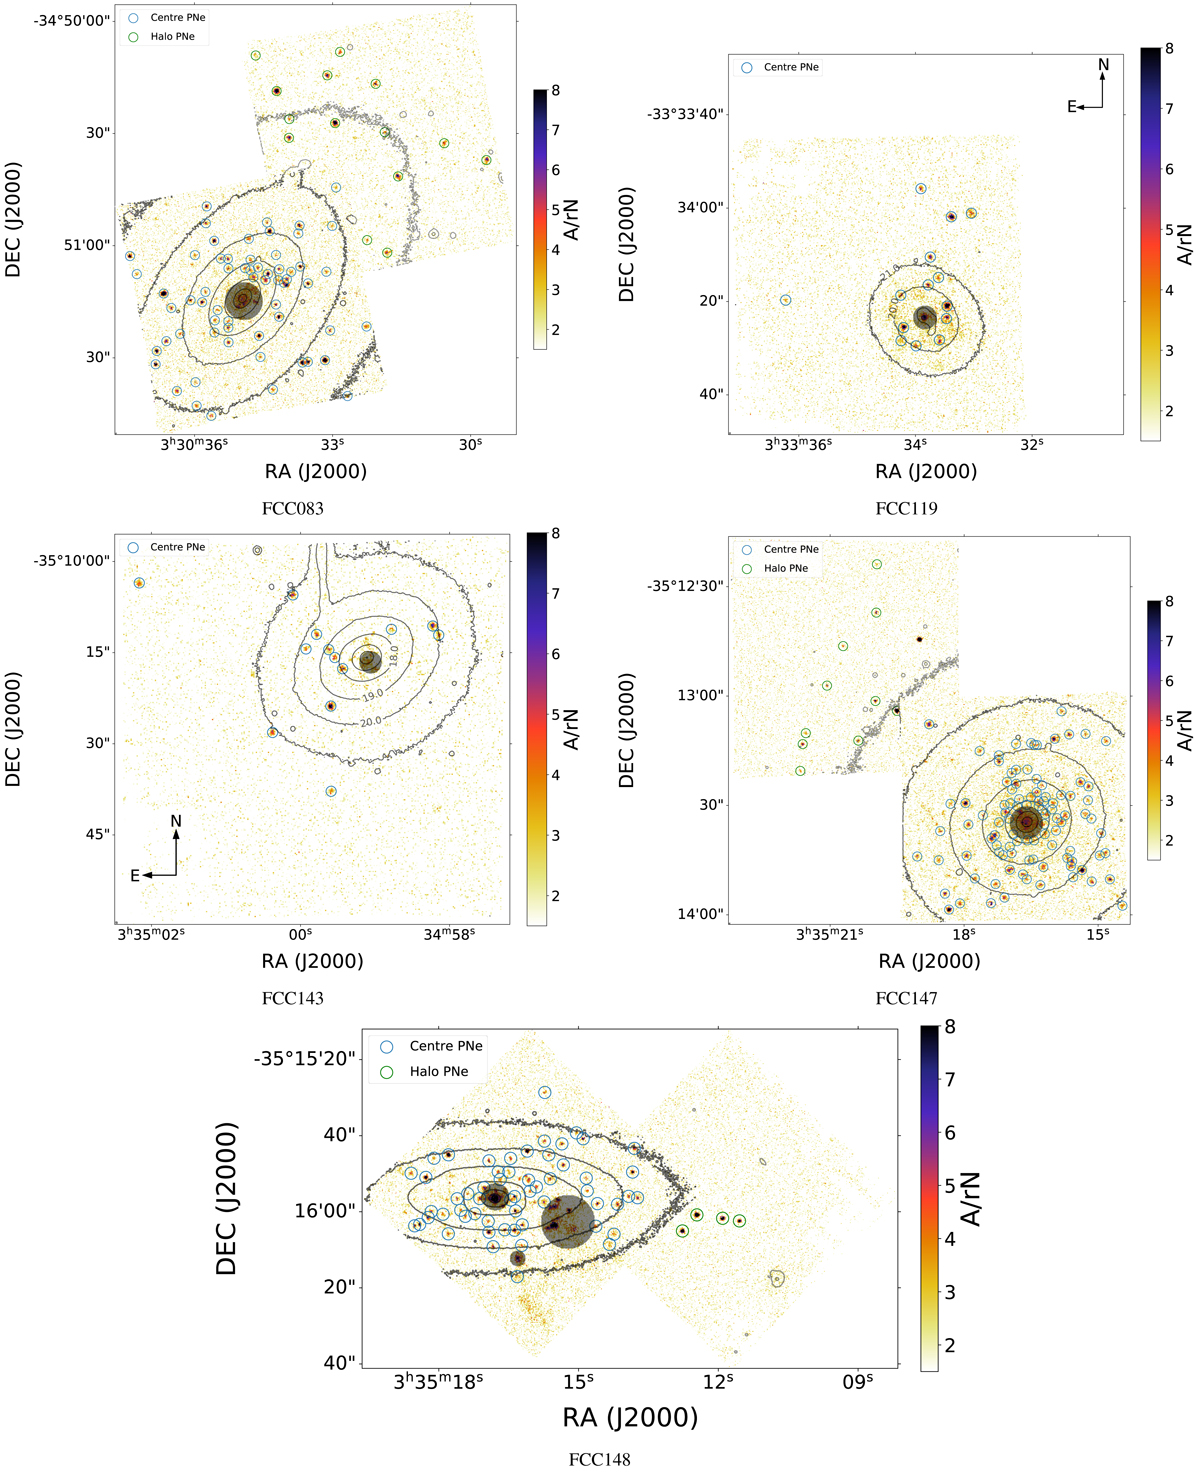
Fig. C.1.
Download original image
Maps for the A/rN ratio between the [O III] 5007 Å line amplitude and residual-noise level derived from our spaxel-by-spaxel spectral fit to the MUSE spectra. Both central and halo pointing are shown, with detected [O III] sources identified by coloured circles: Blue for central PNe, red for Disk (or Middle) PNe and green for Halo PNe. Isophotes are spaced at one mag arcsec−1 intervals. The grey dashed regions indicates the area excluded from our PNe analysis.
Current usage metrics show cumulative count of Article Views (full-text article views including HTML views, PDF and ePub downloads, according to the available data) and Abstracts Views on Vision4Press platform.
Data correspond to usage on the plateform after 2015. The current usage metrics is available 48-96 hours after online publication and is updated daily on week days.
Initial download of the metrics may take a while.