Fig. 6.
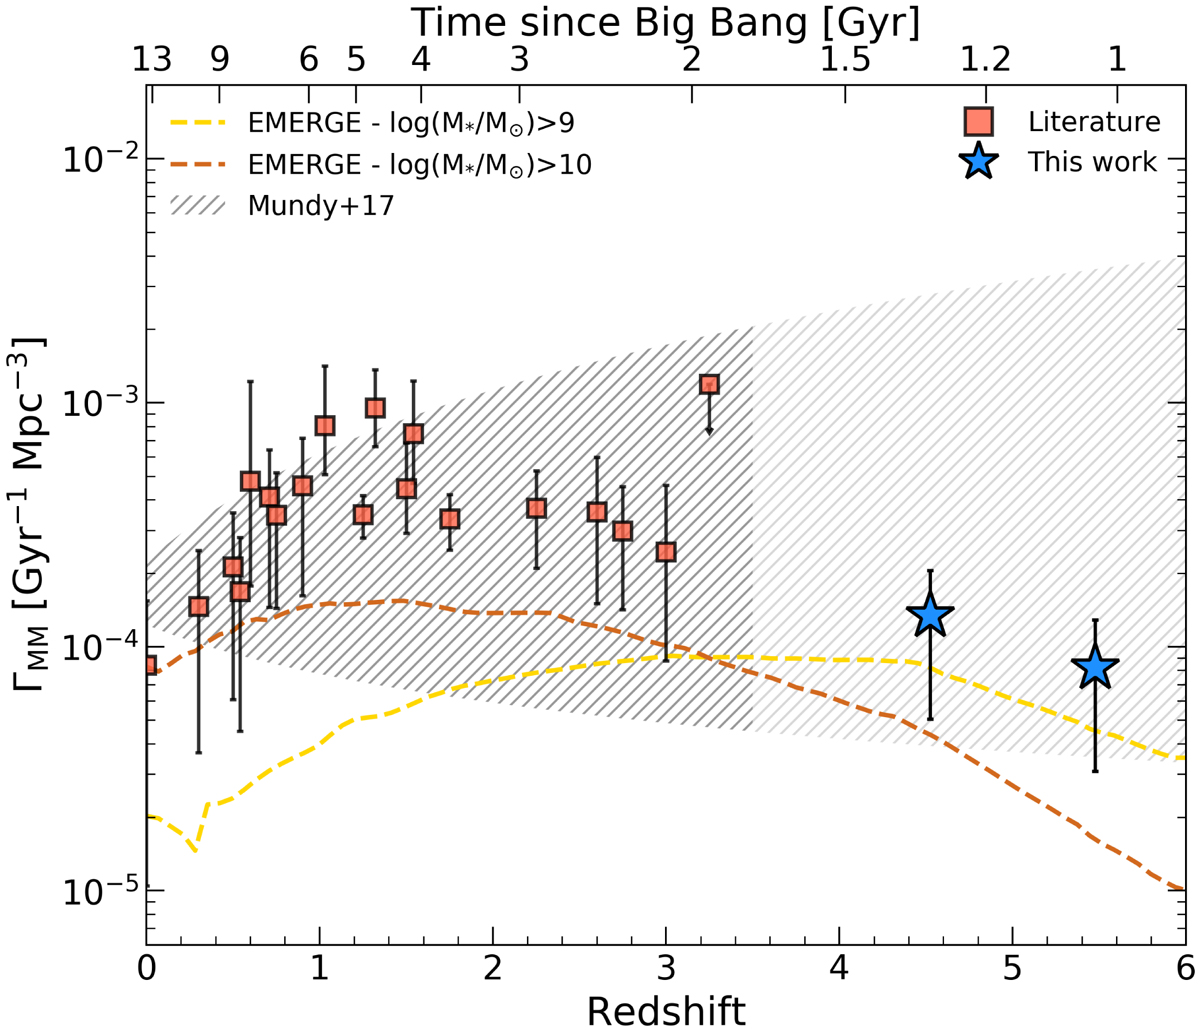
Download original image
Merger rate density as a function of redshift. The squares represent the volume-averaged merger rates computed from the literature data at z < 4 adopting the Kitzbichler & White (2008) prescription for the merger timescale. The blue stars are the ALPINE data at z ∼ 5 from this work. The error bars are obtained by combining in quadrature the uncertainties on the merger fractions and on the number densities. The darker hatched area reports the results including errors by Mundy et al. (2017) at z < 3.5. The lighter area only shows their extrapolation to higher redshifts. The dashed yellow and brown lines display the evolution of ΓMM found with the EMERGE simulation (O’Leary et al. 2021) for galaxies with log(M*/M⊙)> 9 and log(M*/M⊙)> 10, respectively.
Current usage metrics show cumulative count of Article Views (full-text article views including HTML views, PDF and ePub downloads, according to the available data) and Abstracts Views on Vision4Press platform.
Data correspond to usage on the plateform after 2015. The current usage metrics is available 48-96 hours after online publication and is updated daily on week days.
Initial download of the metrics may take a while.