Fig. 5.
Download original image
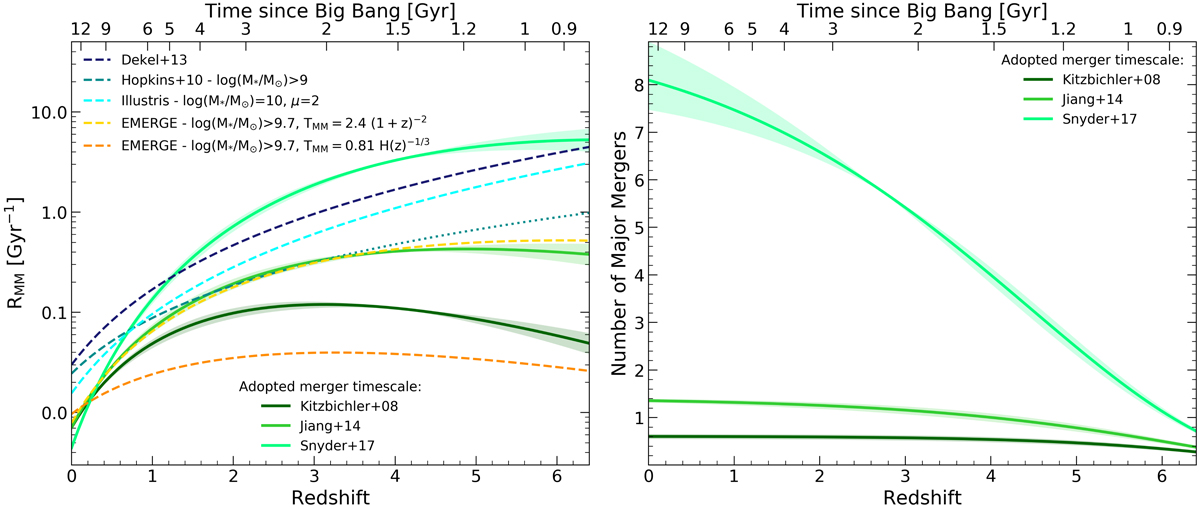
Left panel: redshift evolution of the major merger rate. The solid lines with the shaded regions represent the best-fitting functions to the data assuming three different merger timescales and their associated 1σ uncertainties, respectively. The cosmic evolution of RMM computed from the halo-halo merger rate by Dekel et al. (2013), from the empirical model by Hopkins et al. (2010), and from the Illustris (Rodriguez-Gomez et al. 2015) and EMERGE (O’Leary et al. 2021) simulations are also shown with dashed dark blue, turquoise, cyan, yellow and orange lines. The dotted turquoise line shows the extrapolation of the Hopkins et al. (2010) merger rate to higher redshifts. Right panel: cumulative number of major mergers per galaxy over cosmic time. Solid lines represent the cumulative distributions obtained by integrating Eq. (8) adopting the merger timescale prescriptions of Kitzbichler & White (2008), Jiang et al. (2014) and Snyder et al. (2017). The shaded regions are the associated uncertainties computed from the best-fit errors on the merger rate cosmic evolution.
Current usage metrics show cumulative count of Article Views (full-text article views including HTML views, PDF and ePub downloads, according to the available data) and Abstracts Views on Vision4Press platform.
Data correspond to usage on the plateform after 2015. The current usage metrics is available 48-96 hours after online publication and is updated daily on week days.
Initial download of the metrics may take a while.