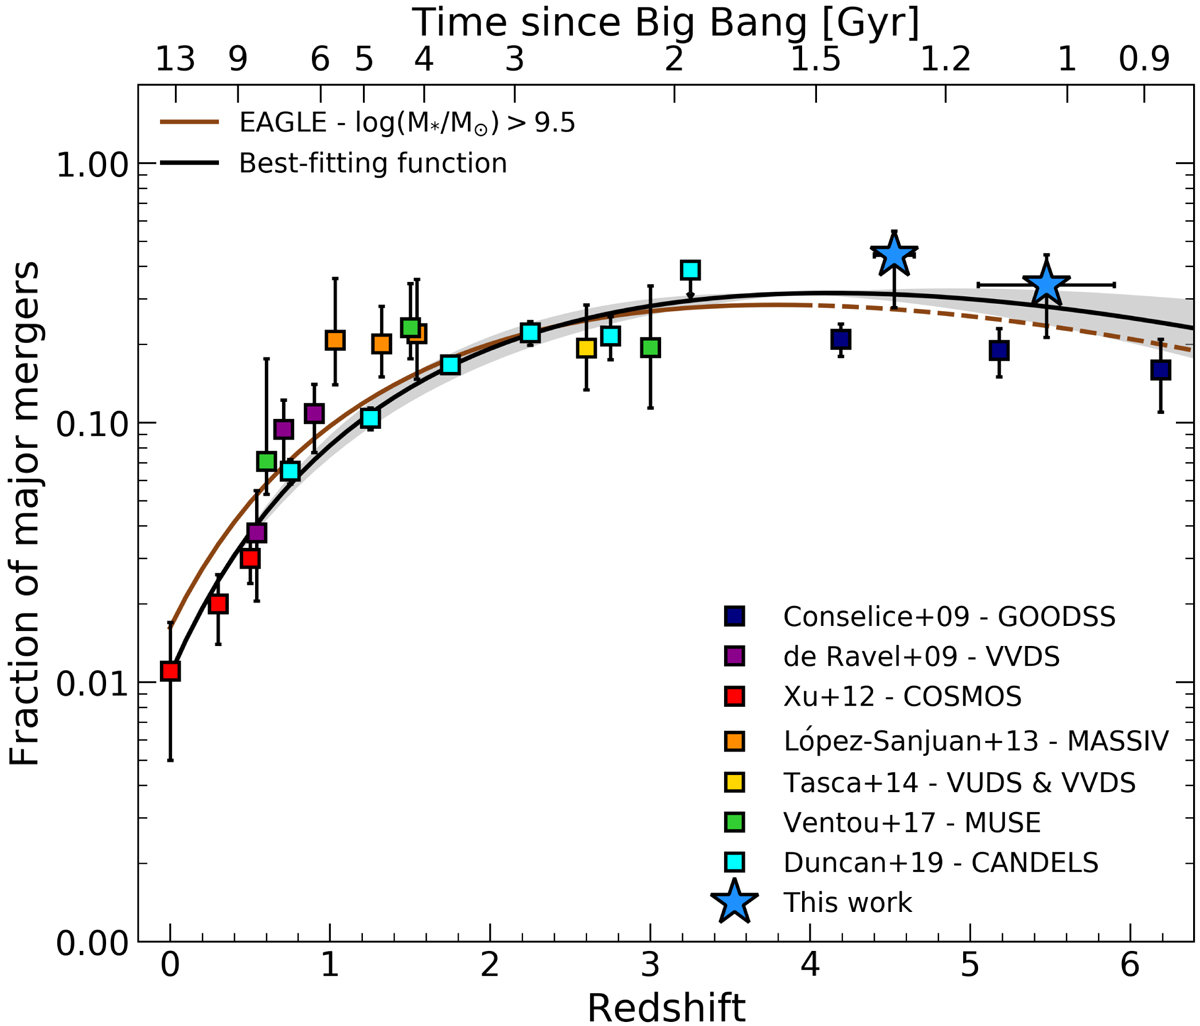
Fig. 4.
Download original image
Cosmic evolution of the major merger fraction fMM from the local to the early Universe. Colored squares show the data collected from the literature at different cosmic times through pair counts, both with spectroscopic (de Ravel et al. 2009; López-Sanjuan et al. 2013; Tasca et al. 2014; Ventou et al. 2017) and photometric (Xu et al. 2012; Duncan et al. 2019) redshifts, and/or morphological studies (Conselice & Arnold 2009). Blue stars are the fMM estimates found in this work. The solid black line and the shaded region are the best-fit to the data with a combined power-law and exponential function and the associated 1σ error, respectively. Finally, the solid brown line illustrates the parameterized redshift evolution (up to z = 4) of the major merger fraction from the EAGLE simulation for galaxies with log(M*/M⊙)> 9.5. The dashed line is just an extension of that curve to higher redshifts.
Current usage metrics show cumulative count of Article Views (full-text article views including HTML views, PDF and ePub downloads, according to the available data) and Abstracts Views on Vision4Press platform.
Data correspond to usage on the plateform after 2015. The current usage metrics is available 48-96 hours after online publication and is updated daily on week days.
Initial download of the metrics may take a while.